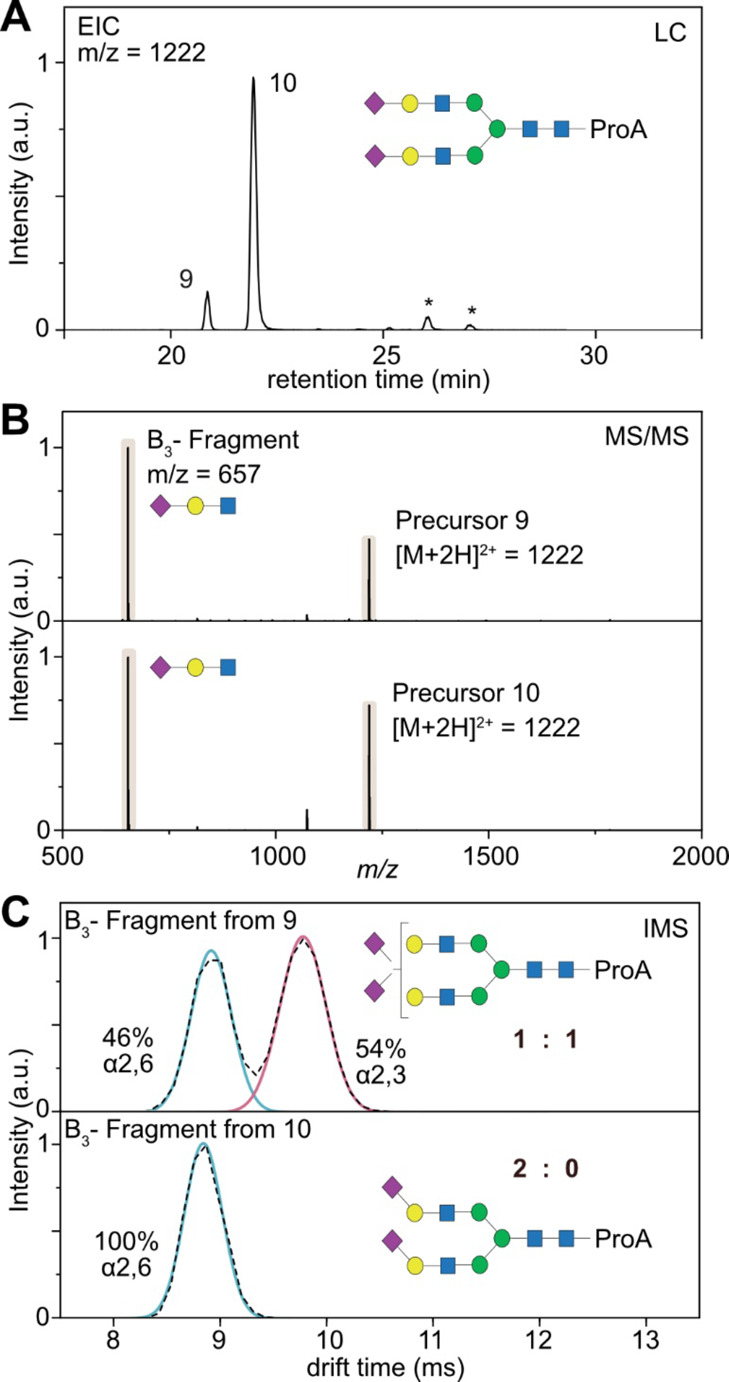
Figure 3.

HILIC-CID-IM-MS feature mapping of released glycans of hAGP. (A) Extracted ion chromatogram (EIC) of a doubly sialylated biantennary glycan (m/z = 1222) in positive ion mode. Minor peaks marked with an asterisk are fragment ions generated from larger glycans. (B) MS/MS spectra of the precursor ions 9 and 10, which are almost identical and show the dominant B3 trisaccharide fragment. (C) Mobilograms of the B3 fragment generated from precursor ions 9 and 10. Comparison with the synthetic standards (red and blue overlay) allows us to identify the sialic acid isoforms and to deduce the general structure of the glycans 9 and 10. The numbering of the LC peaks refers to Tables S2 and S4 in the Supporting Information, which contains all observed glycans.
