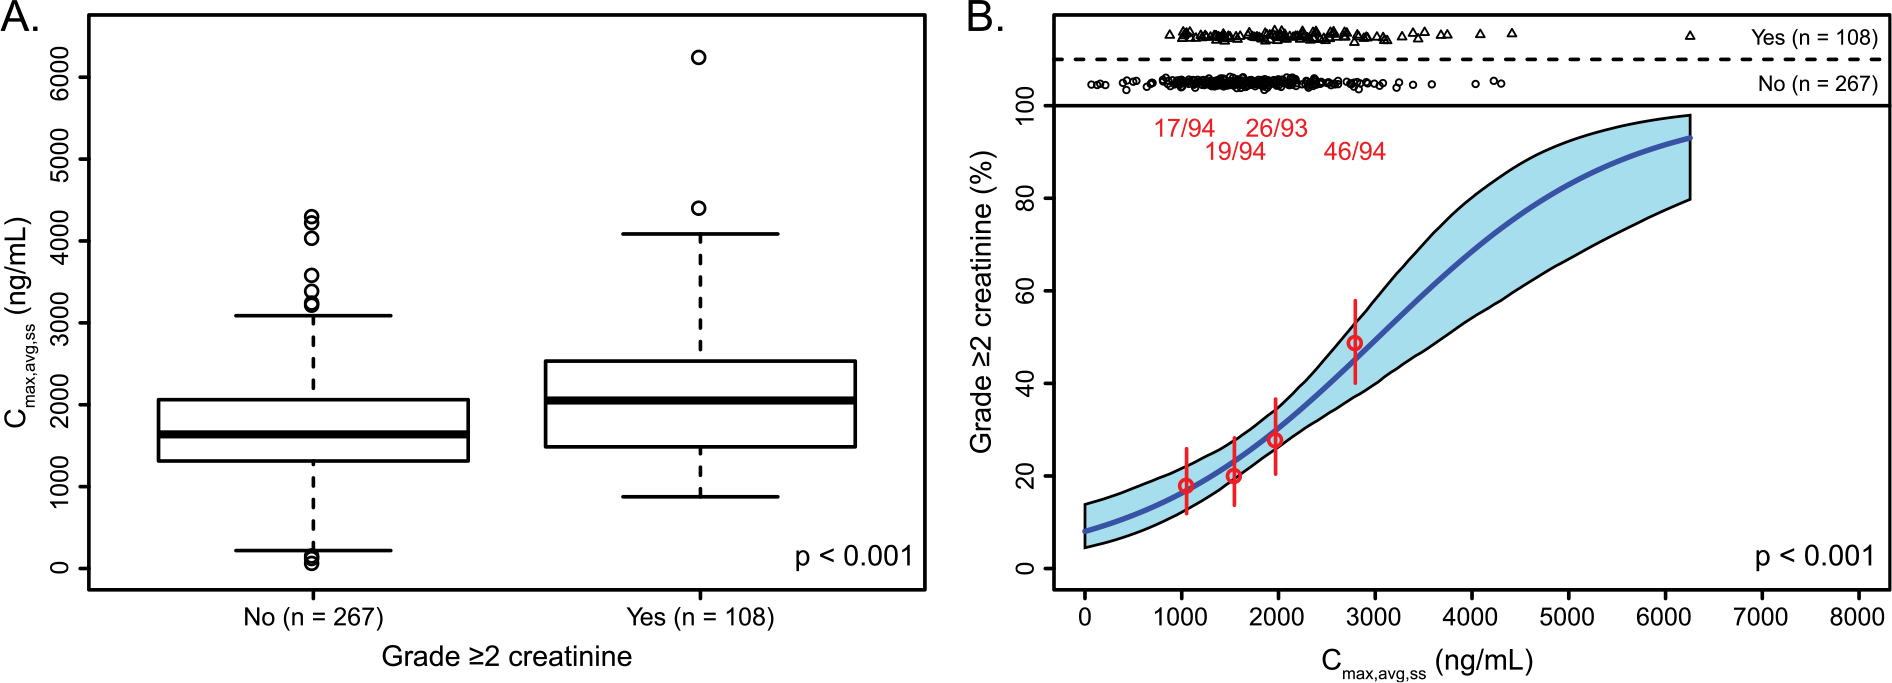
Fig. 3.

Exposure-safety relationships for creatinine. (A) Box plots show the maximum concentration of rucaparib, stratified by grade ≥2 creatinine increase. (B) Red points represent the mean exposure and event rates in patients stratified by exposure quartile. Vertical red bars represent the 5th to 95th percentile confidence intervals on the event rate. Event numbers (patients with event/total patients) are displayed above each vertical bar. Regression analyses were conducted for patients with grade ≥2 creatinine increase. The solid blue line is the logistic regression model fit for that patient subset. The shaded blue region represents 5th to 95th percentile confidence interval on the predicted event rate. Cmax,avg,ss, average maximum concentration at steady state.
