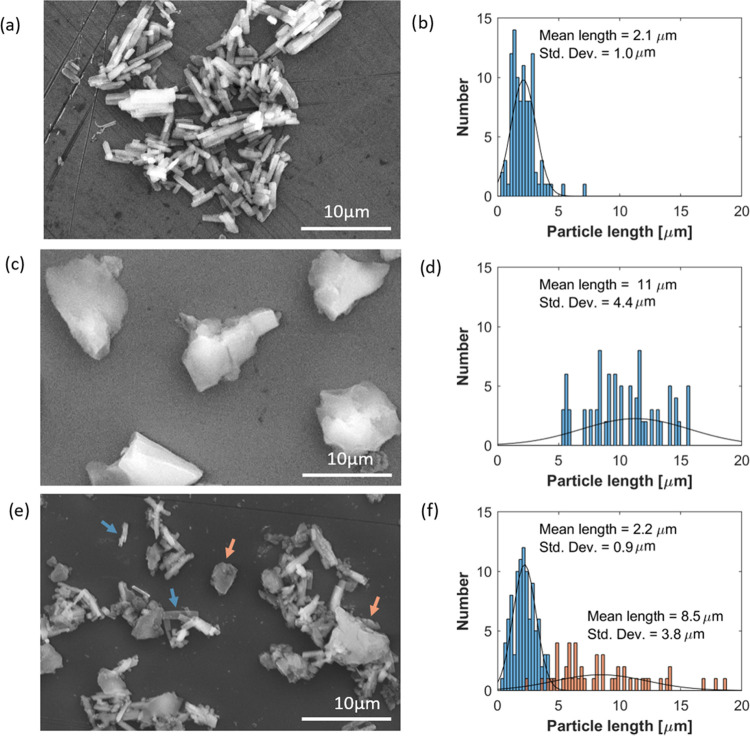
Figure 4.
SEM images and the corresponding size distributions of (a, b) pure CuPT crystals, (c, d) pure silica aerogels (SA), and (e, f) CuPT crystals encapsulated by silica aerogels (sample C75SA). The distributions were obtained from manual analysis of SEM images in ImageJ software, and the term “length” refers to the greatest dimension of the particles. Arrows, in colors corresponding to their size distribution, indicate two distinct morphologies of sample C75SA.

