Figure 2.
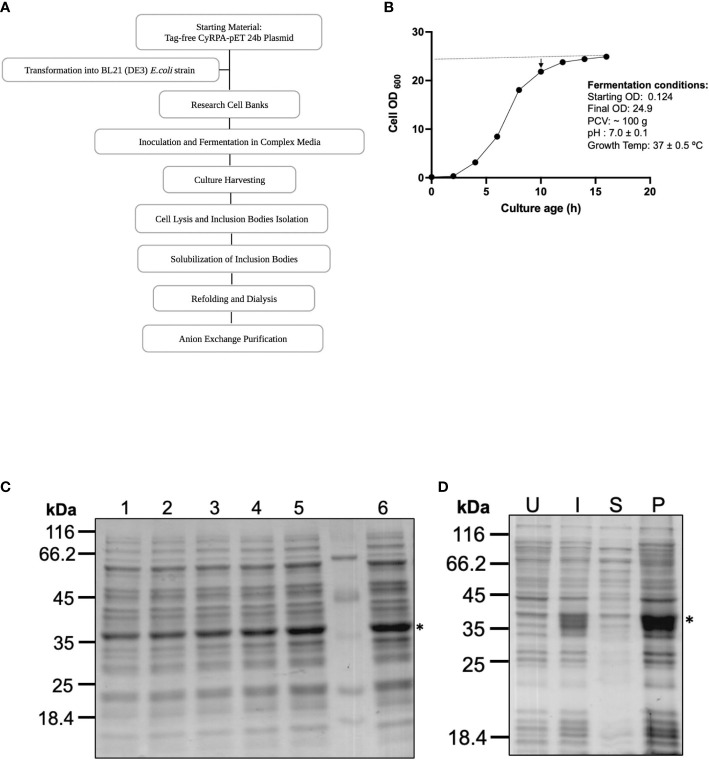
Process Development for Large Scale Production of Tag-free CyRPA. (A) Flow chart depicting the steps involved in the process development of tag-free CyRPA. (B) Time-point graph showing the entire 16 hours long fermentation run for CyRPA expressing BL21 (DE3) cells biomass production. Arrowhead indicates induction time point after 10 hours of culture growth. At this point, culture has started to enter the stationary phase. Dotted line shows that a constant pH was maintained throughout fermentation process. (C) CyRPA expression was monitored each hour by SDS-PAGE, which confirmed protein expression at different time points (1,2,3,4,5 and 6 hours) after induction. (D) Post fermentation, the expression of CyRPA was checked by reducing SDS-PAGE in uninduced, induced, supernatant and pellet fractions after cell lysis. Consistent with small scale results, expression can be found in pellet fraction or inclusion bodies. * indicating the position of CyRPA. UI, Uninduced; I, Induced; S, Supernatant; P, Pellet.

