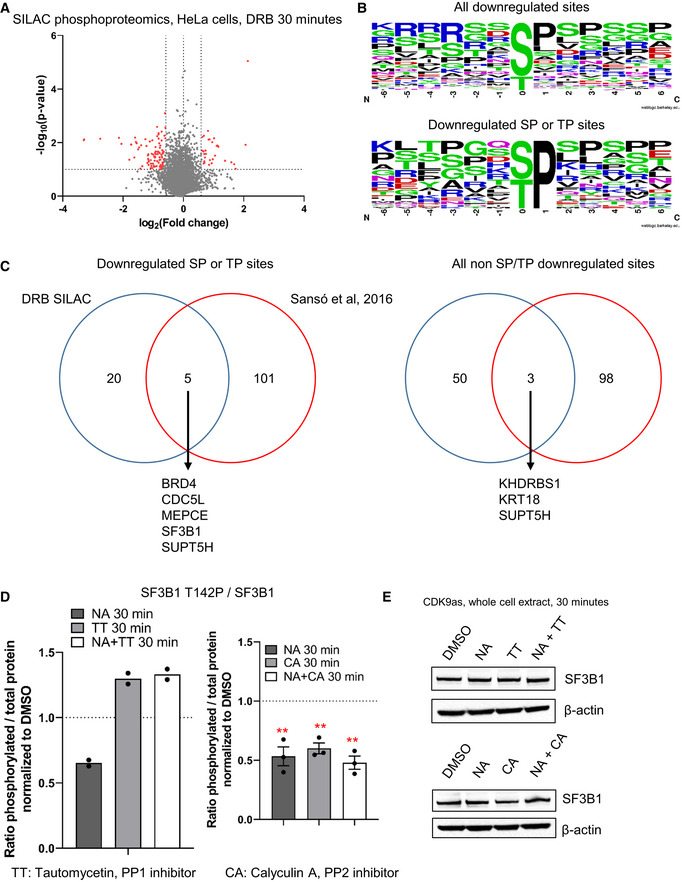
Figure EV3. CDK9 phosphorylates several transcription and splicing factors in vivo .

-
AVolcano plot of SILAC phosphoproteomics in HeLa cells treated or not with 100 μM DRB for 30 min (in red: fold change > 1.5 in both biological duplicates, P‐value < 0.1).
-
BMotif found around all the phosphorylation sites decreased following CDK9 inhibition of only the phosphorylation sites containing a ST or TP sites.
-
COverlap between the proteins found to have at least one phosphopeptides decreased in our study versus an alternative experimental strategy used to identify CDK9 targets in cell extracts (Sanso et al, 2016).
-
DQuantification of the Western blots shown in Fig 4B. n = 2 biological replicates for the TT set, n = 3 biological replicates for the CA set, mean ± SEM, P‐value: **P < 0.01, ***P < 0.001. Statistical test: two‐tailed unpaired t‐test.
-
EWestern blot of SF3B1 and β‐actin, as a loading control, on the whole‐cell extract of CDK9as cells after 30‐min DMSO, NA, CA, or NA + CA treatment, or DMSO, NA, TT, NA + TT treatment.
Source data are available online for this figure.
