-
A
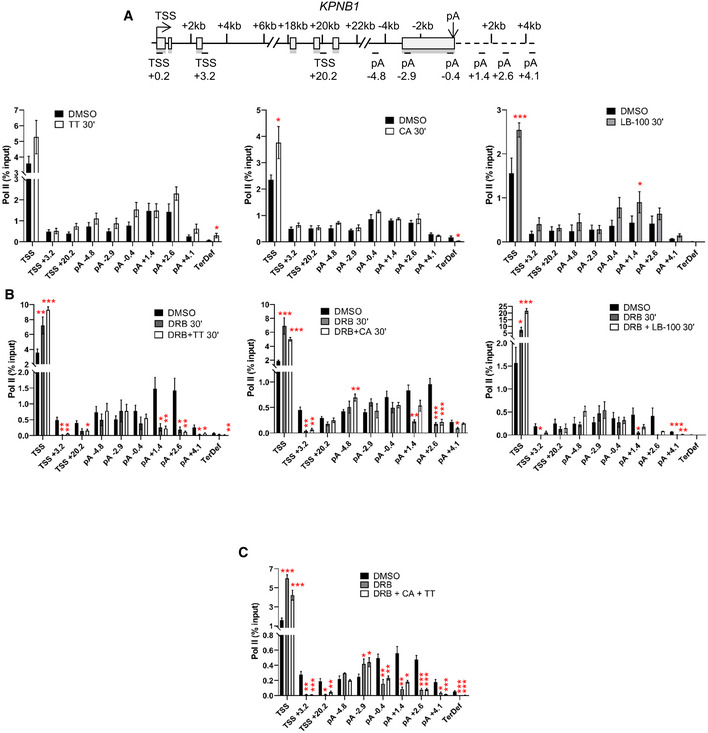
ChIP‐qPCR of total pol II after 30‐min treatment with DMSO, TT, CA, or LB‐100 on KPNB1. n = 3 biological replicates, mean ± SEM, P‐value: *P < 0.05, **P < 0.01, ***P < 0.001. Statistical test: two‐tailed unpaired t‐test.
-
B
ChIP‐qPCR of total pol II after 30‐min treatment with DMSO, DRB, DRB + TT, DRB + CA, or DRB + LB‐100 on KPNB1. n = 3 biological replicates, mean ± SEM, P‐value: *P < 0.05, **P < 0.01, ***P < 0.001. Statistical test: two‐tailed unpaired t‐test.
-
C
ChIP‐qPCR of total pol II after 30‐min treatment with DMSO or DRB + CA + TT on KPNB1. n = 3 biological replicates, mean ± SEM, P‐value: *P < 0.05, **P < 0.01, ***P < 0.001. Statistical test: two‐tailed unpaired t‐test.

