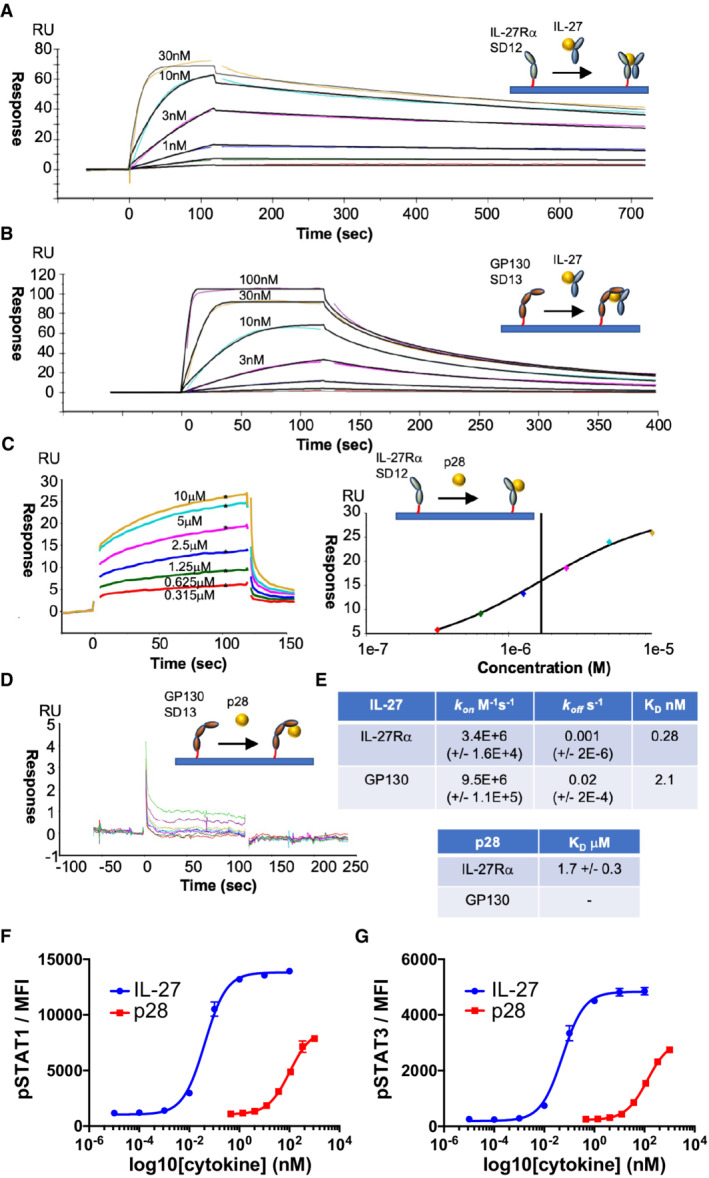
Figure 3. Biophysical analysis of the assembly of the IL‐27 receptor complex.

-
A–EFor SPR measurements, IL‐27Rα or GP130 was immobilized on the chip surface by biotin–streptavidin interaction and IL‐27 or p28 was flowed across the chip in solution. SPR data are representative of three biological replicates. Kinetic charts for IL‐27Rα (A) and GP130 (B). Concentrations used are shown on the curves. Data traces were fitted using a 1:1 interaction model (black) to quantify the kinetics (kon, koff) and binding affinity (KD) of the interactions. (C, D) Equilibrium chart for p28 binding to IL‐27Rα (C, left panel) and curve‐fitting to data points generated at various concentrations of p28 (C, right panel). (D) Equilibrium chart for p28 binding GP130. (E) Table presenting kinetically derived (IL‐27) and thermodynamically derived (p28) binding constants. Standard Error values (SEs) are shown in parentheses.
-
F, GDose response curves for pSTAT1 (F) and pSTAT3 (G) in resting mouse CD8+ T cells. Cells were stimulated with mIL‐27 or p28 for 15 min with the indicated doses. Data shown are the mean of four biological replicates with error bars depicting standard error of the mean.
