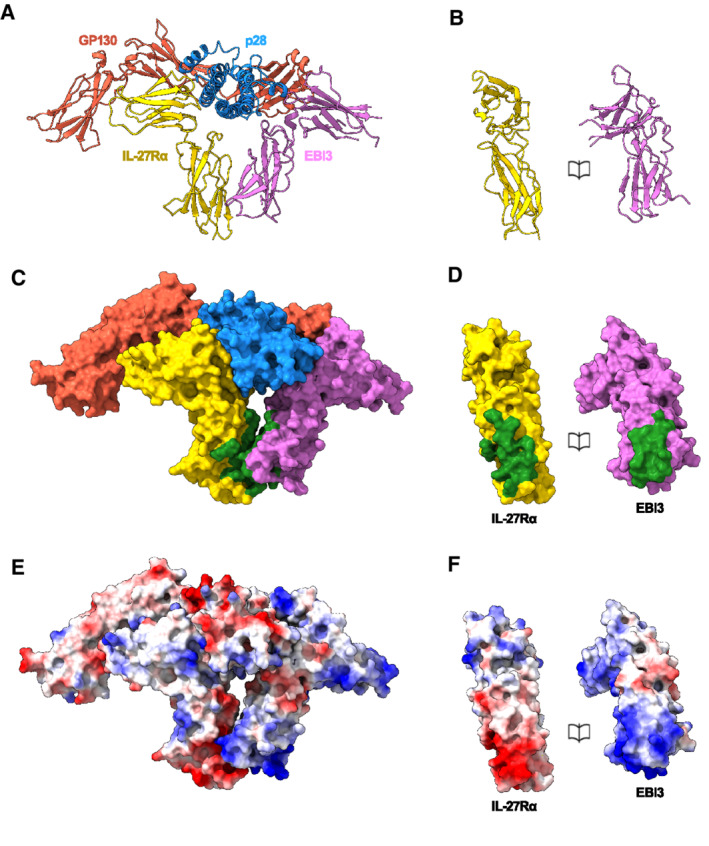
Figure EV5. EBI3:IL‐27Rα interface.

-
A–FRibbon representation of the IL‐27 receptor recognition complex (A) and book representation of the EBI3:IL‐27Rα interface (B). Individual proteins colored: EBI3 (purple), IL‐27Rα (yellow), p28 (blue), GP130 (red). Surface representation of the complex (C) and book representation of the interface (D). Proteins colored as in (A) with EBI3: IL‐27Rα interface residues in green. Coulombic electrostatic potential ranging from −10 (red) to 10 (blue) kcal/(mole) calculated from the models in A (E) and corresponding book representation of the interface (F).
