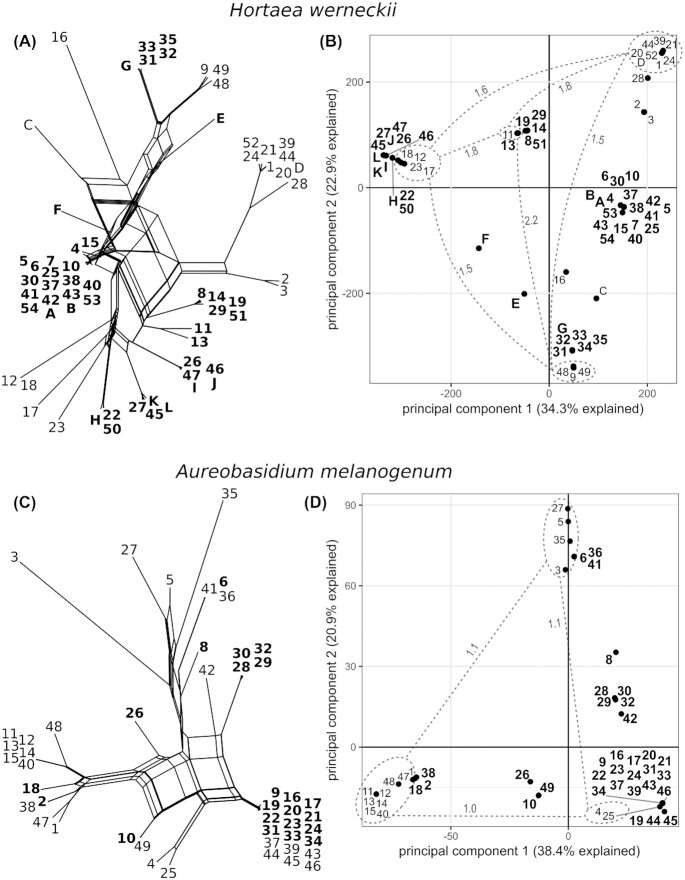
Figure 1:
Single-nucleotide polymorphism (SNP) diversity of Hortaea werneckii (A, B) and Aureobasidium melanogenum (C, D). Names of diploid strains are written in bold. (A, C) Phylogenetic networks reconstructed with a Neighbor-Net algorithm from a dissimilarity distance matrix calculated from SNP data. (B, D) Principal component analysis of SNPs. The genomes are represented by circles. The average divergence between groups of haploid genomes (dashed lines) is expressed as millions of SNPs (numbers next to dashed lines).

