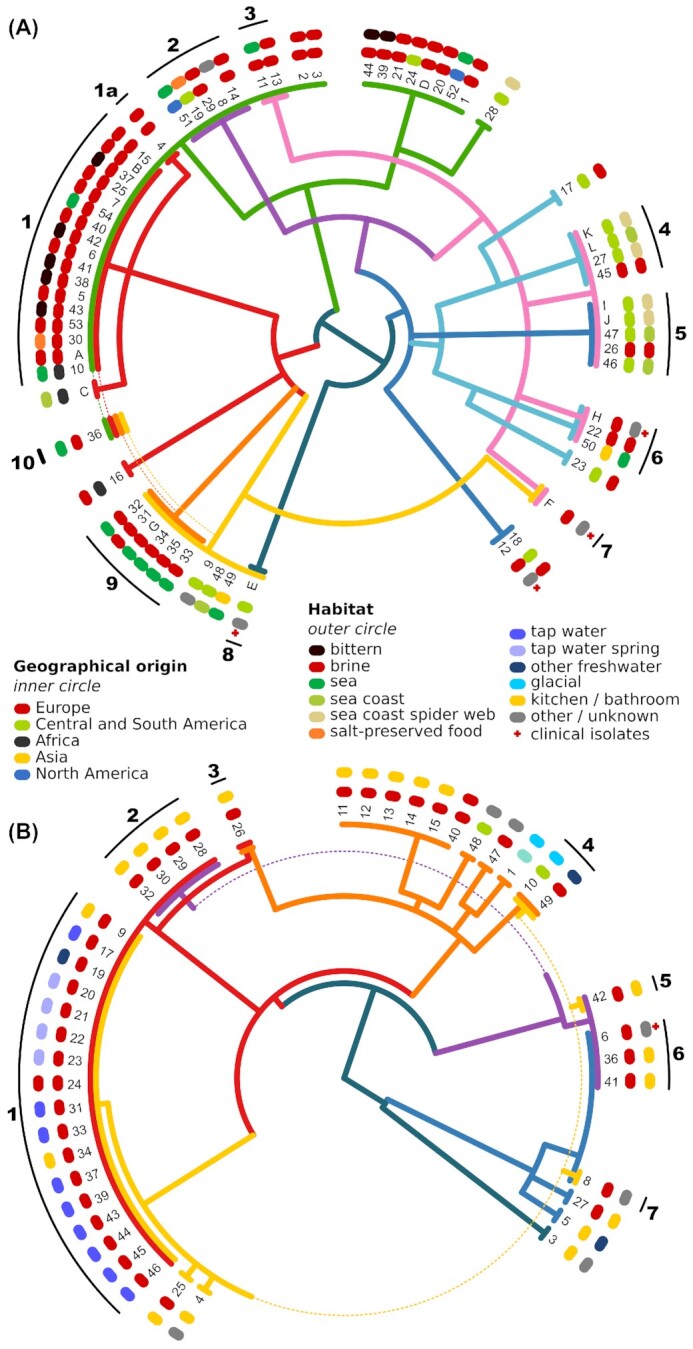
Figure 4:

Hypothesis of the genome evolution and hybridization in Hortaea werneckii (A) and Aureobasidium melanogenum (B). The hypothesis is based on the majority consensus phylogeny of 50 longest alignable regions per species. Each colored line in the central tree represents a haploid genome. The distances between the nodes of the tree correspond to the distances in an ultrametric majority consensus phylogeny. Haploid genomes are represented by a single colored line in the outermost edge of the tree, diploid genomes are represented by a double colored line, and the only tetraploid genome is represented by 4 colored lines. Around the tree, colored symbols mark the continent (inner circle) and habitat (outer circle) from which the strains have been originally isolated. Black lines and numbers in the outermost circle mark the genome/strain groups presumably originating from the same hybridization event.
