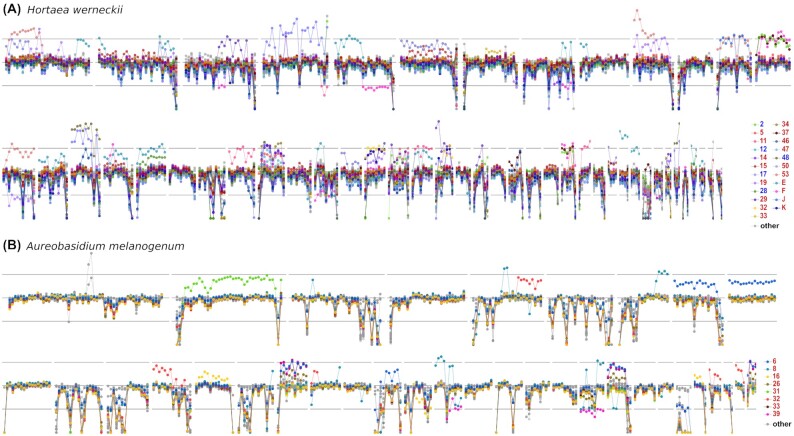
Figure 5:
Aneuploid regions in Hortaea werneckii (A) and Aureobasidium melanogenum (B) genomes. Per-nucleotide sequencing depth of regions corresponding to the 50 and 35 longest contigs of H. werneckii and A. melanogenum was converted into proportion of the median sequencing depth of each individual genome. Circles represent an average of this depth in 30-kbp windows. The central horizontal line marks the median sequencing depth of the genome. Upper and lower horizontal lines mark the expected depth for haploid and triploid regions in an otherwise diploid genome. Genomes with at least 1 putatively aneuploid region are plotted in color. Other genomes are plotted in light gray. Colors of strain names in the legend mark haploid (blue) and diploid (red) genomes.

