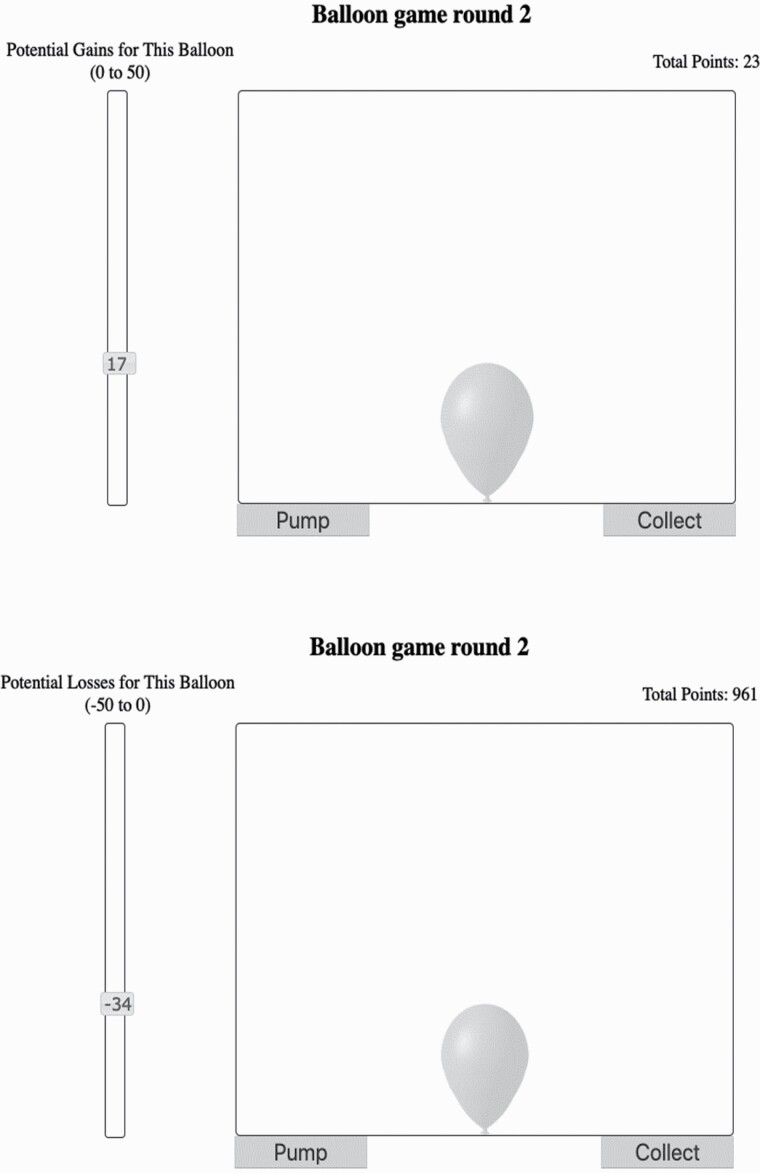
Figure 1.
Sample screenshots for the pumping phase of the Balloon Analogue Risk Task (BART) showing the gain frame (top) and the loss frame (bottom). Participants pressed “pump” to indicate the desired number of pumps. Pumps were visualized by both the increasing size of the shaded balloon and by the scale on the left. Participants pressed “collect” to have the computer automatically implement the desired number of pumps resulting in either a pop or a nonpop. Trial number and cumulative points were shown at the top. Complete instructions are provided in Supplement B.

