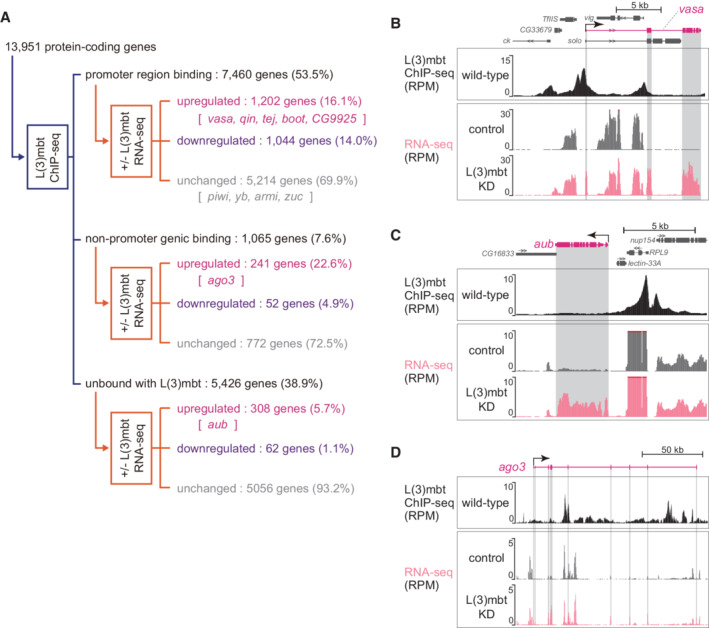
Figure 1. L(3)mbt controls target gene expression in complex fashions.

-
AThe 13,951 protein‐coding genes of Drosophila were classified into “promoter region binding,” “nonpromoter genic binding,” and “unbound with L(3)mbt” in accordance with the L(3)mbt ChIP‐seq reads, and were subsequently divided into “upregulated,” “downregulated,” and “unchanged” in accordance with the RNA‐seq reads from OSCs before and after L(3)mbt depletion [+/− L(3)mbt]. Representatives of piRNA factors are indicated within the groups. ChIP‐seq was performed twice technically and RNA‐seq three times.
-
B–DThe genomic regions harboring vasa (B), aub (C), and ago3 (D). The gene structure is shown at the top. The arrow depicts the TSS and the orientation of transcription. The L(3)mbt ChIP‐seq reads in normal OSCs (wild‐type) and RNA‐seq reads from L(3)mbt‐depleted [L(3)mbt KD] and control OSCs are shown under the gene structure. The shading in gray corresponds to exons. The y‐axis shows the number of reads per million mapped reads (RPM).
