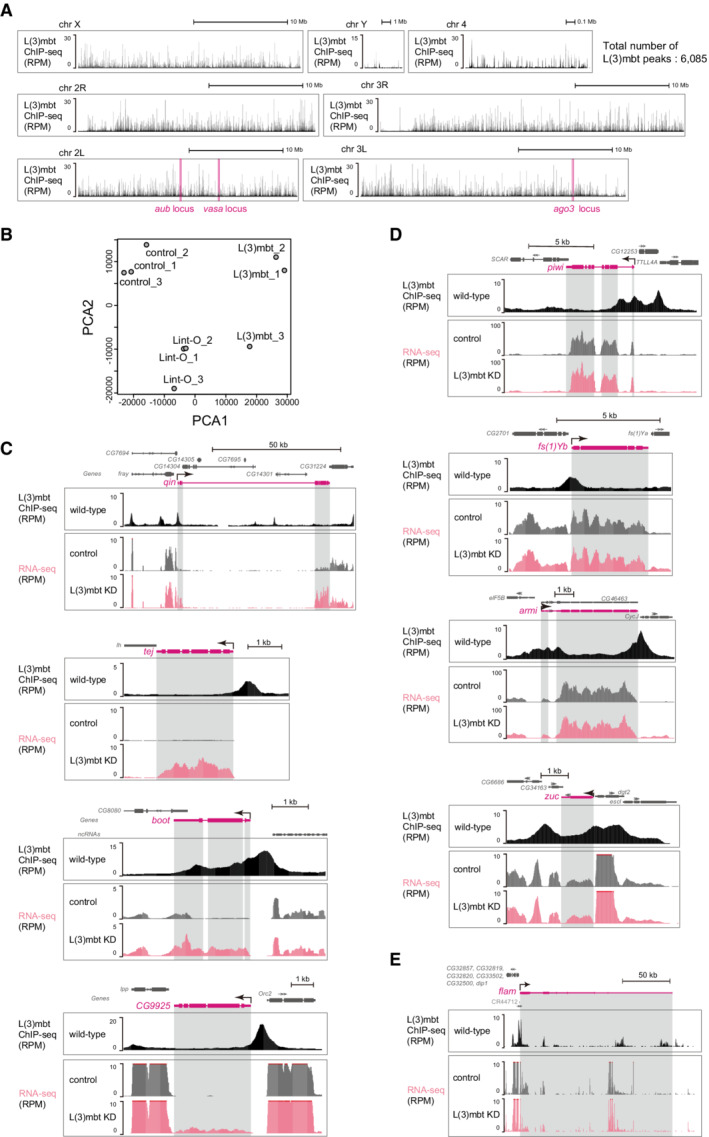
Figure EV2. Genomic distribution of L(3)mbt and the effects of L(3)mbt loss on the expression levels of piRNA factors in OSCs.

-
AGenomic browser views of L(3)mbt ChIP‐seq signals. All fly chromosomes are shown. The vasa, ago3, and aub loci are indicated. The total number of L(3)mbt ChIP peaks is shown in upper right.
-
BPCA shows the correlation in the RNA‐seq libraries. Control: GFP siRNA was used.
-
C–EThe genomic regions harboring qin, tej, boot, and CG9925 (C), piwi, yb, armi, and zuc (D), and flam (E).
