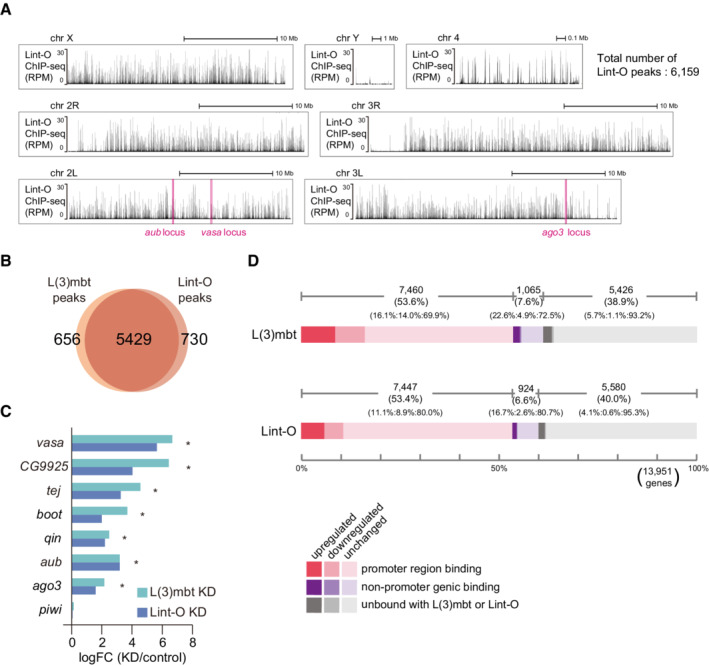
Figure EV4. Lint‐O OSC ChIP‐seq and RNA‐seq before and after Lint‐O depletion in OSCs.

- Genomic browser views of the Lint‐O ChIP‐seq reads. All fly chromosomes are shown. The y‐axis shows the number of RPM. The vasa, ago3, and aub loci are indicated. The total number of Lint‐O ChIP peaks is shown in upper right.
- Overlap between Lint‐O ChIP peaks in (A) and L(3)mbt ChIP peaks (Fig EV2A).
- vasa, CG9925, tej, boot, qin, aub, and ago3 were identified as upregulated genes (* q‐value <0.05) in RNA‐seq analysis. The log fold change of the differential expression for each piRNA pathway gene was calculated based on the RNA‐seq data from normal (control), L(3)mbt‐depleted (KD), and Lint‐O‐depleted (KD) OSCs. The y‐axis shows the ratio of the read counts between L(3)mbt‐ and Lint‐O‐depleted OSCs and the normal OSCs.
