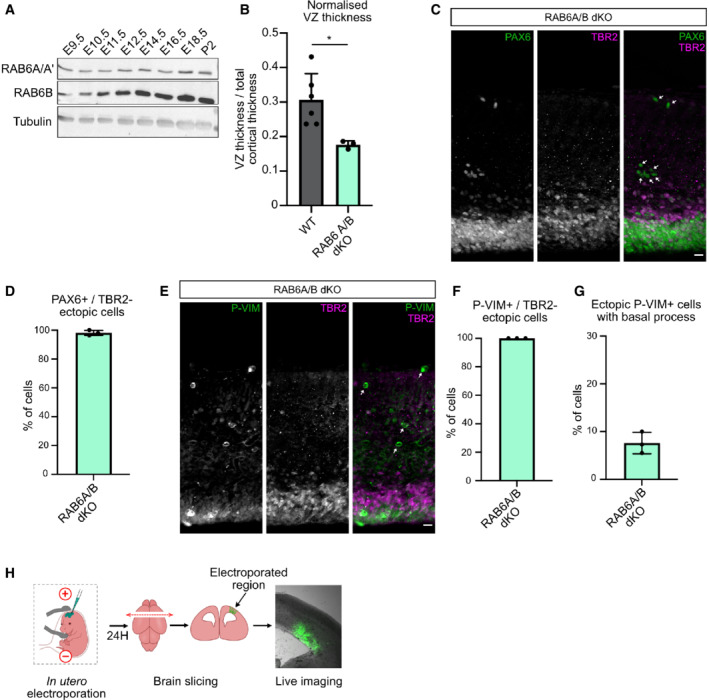
Figure EV1. RAB6 A/B dKO leads to ectopic TBR2‐negative basal progenitors.

-
ARAB6A/A' and RAB6B expression in the developing brain and at P2.
-
BVentricular zone (VZ) thickness normalized to total cortical thickness in N = 6 WT brains and N = 3 RAB6A/B dKO. Mann–Whitney U test, *P ≤ 0.05.
-
CPAX6 and TBR2 staining in RAB6A/B dKO E15.5 brains. Arrows indicate detached PAX6+/TBR2− cells. Scale bar = 25 μm.
-
DPercentage of ectopic PAX6+/TBR2− cells in RAB6A/B dKO E15.5 brains. RAB6A/B dKO: 470 cells from N = 3 brains.
-
EP‐VIM and TBR2 staining in RAB6A/B dKO E15.5 brains. Arrows indicate detached P‐VIM+/TBR2− cells. Scale bar = 25 μm.
-
FPercentage of ectopic P‐VIM+/TBR2− cells in RAB6A/B dKO E15.5 brains. RAB6A/B dKO: 99 cells from N = 3 brains.
-
GPercentage of ectopic P‐VIM+ cells that maintained a basal process in RAB6A/B dKO E15.5 brains. RAB6A/B dKO: 99 cells from N = 3 brains.
-
HSchematic representation of in utero electroporation and live imaging procedure in the mouse developing cortex.
Data information: All error bars indicate SD.
