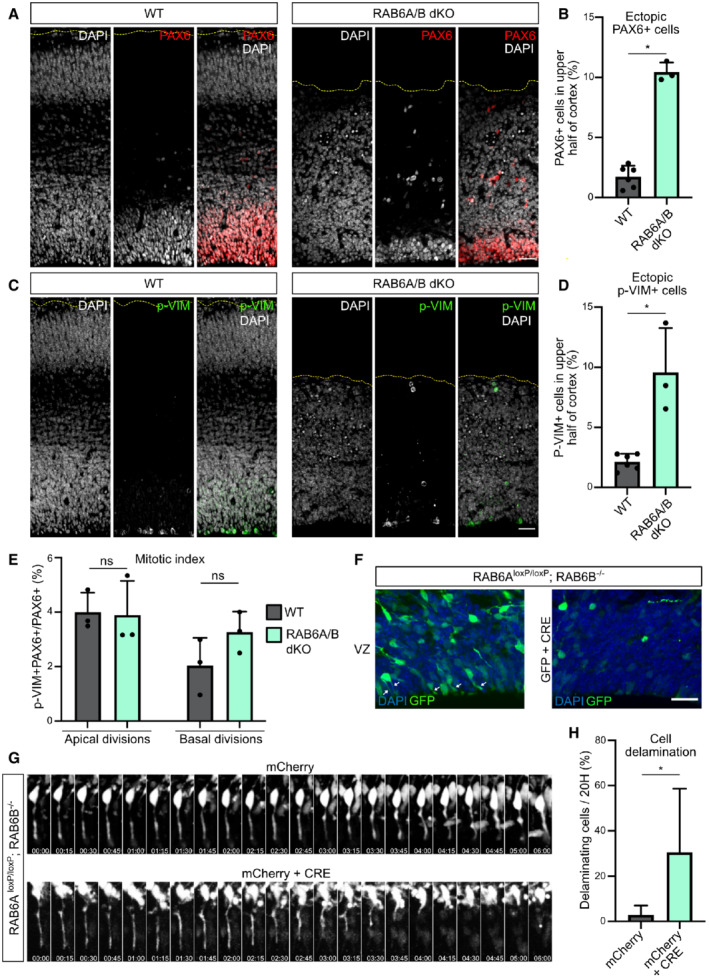
Figure 2. RAB6A/B dKO leads to aRG cell delamination during interphase.

-
APAX6 staining in WT and RAB6A/B dKO E15.5 brains. Scale bar = 50 μm.
-
BPercentage of PAX6+ cells located in the upper half of the cortex of WT and RAB6A/B dKO E15.5 brains. WT: 4282 cells from N = 6 brains. RAB6A/B dKO: 1,241 cells from N = 3 brains. Mann–Whitney U test.
-
CPhospho‐Vimentin (p‐Vim) staining in WT and RAB6A/B dKO E15.5 brains. Scale bar = 50 μm.
-
DPercentage p‐VIM+ cells dividing ectopically, in the upper half of the cortex of WT and RAB6A/B dKO E15.5 brains. WT: 1,713 cells from N = 6 brains. RAB6A/B dKO: 506 cells from N = 3 brains. Mann–Whitney U test.
-
EMitotic index (p‐VIM+ PAX6+ / PAX6+ cells) of RG cells dividing apically (at the ventricular surface) or basally (upper half) in WT and RAB6A/B dKO E15.5 brains. Apical divisions: N = 1,886 cells from 3 brains for WT and 1,511 cells from 3 brains for RAB6A/B dKO. Basal divisions: N = 643 cells from 3 brains for WT and 809 cells from 3 brains for RAB6A/B dKO. Mann–Whitney U test.
-
FElectroporation of RAB6A loxP/loxP ; RAB6B −/− E14.5 embryos with GFP (control) or GFP + CRE (RAB6A/B dKO) and fixation at E18.5. Localization of GFP+ cells in the ventricular zone (VZ). White arrows indicate apical processes. Scale bar = 25 μm.
-
GElectroporation of RAB6A loxP/loxP ; RAB6B −/− E14.5 embryos with mCherry (control) or mCherry + CRE (RAB6A/B dKO) and live imaging of delamination events at E17.5.
-
HApical endfoot detachment and retraction events during 20 h movies in mCherry or mCherry + CRE electroporated cells at E17.5. mCherry: N = 69 cells from 5 movies. mCherry + CRE: N = 52 cells from 4 movies. Fisher's exact test, *P ≤ 0.05.
Data information: All error bars indicate SD.
