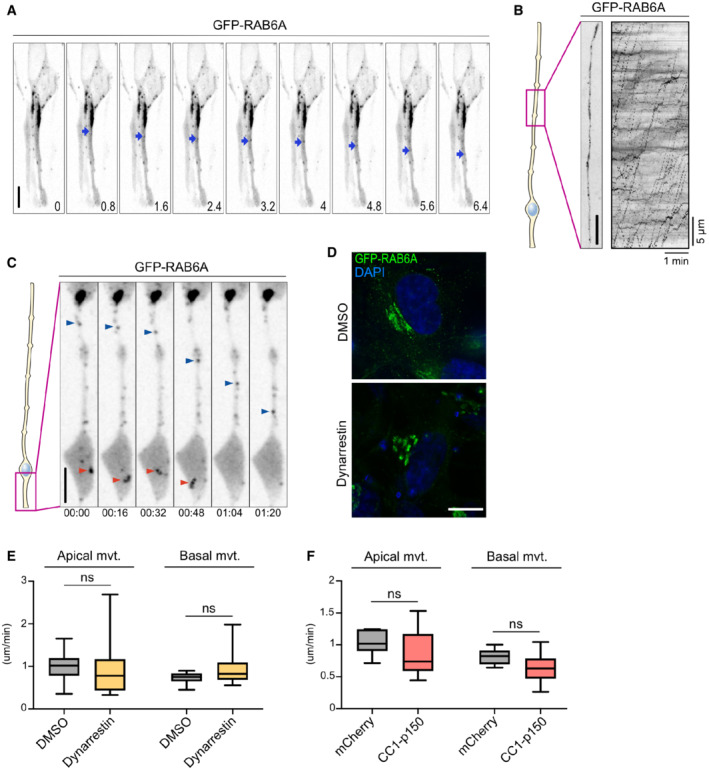
Figure EV2. RAB6A dynamics in aRG cells and dynarrestin validation.

-
ALive imaging of GFP‐RAB6A in the apical process of an aRG cell at E15.5. At 0.8 s, a tubule is budding from the Golgi, leading to the formation of an apically moving vesicle. Blue arrowhead indicates RAB6A+ vesicle. Scale bar = 5 μm.
-
BLive imaging of GFP‐RAB6A in the basal process of an aRG cell at E15.5. Right: kymograph. Scale bar = 5 μm.
-
CLive imaging of GFP‐RAB6A in the apical process of an aRG cell at E15.5. Red arrowhead: a RAB6A+ vesicle can be seen disappearing in the endfoot, suggesting fusion with the apical membrane. Blue arrowhead: a RAB6A+ vesicle moving apically within the apical process. Scale bar = 10 μm.
-
DRPE‐1 cells transfected with GFP‐RAB6A to visualize the Golgi apparatus architecture, and treated for 4 h with 100 μM dynarrestin or DMSO. Scale bar = 10 μm.
-
EVelocity of apically and basally moving RAB6A vesicles within the apical process of DMSO and dynarrestin‐treated aRG cells. In all, 142 vesicles from N = 7 cells for DMSO, 74 vesicles from N = 18 cells for dynarrestin.
-
FVelocity of apically and basally moving RAB6A vesicles within the apical process of mcherry control and CC1‐p150‐expressing aRG cells. In all, 120 vesicles from N = 17 cells for mCherry control, 39 vesicles from N = 11 cells for CC1‐p150.
Data information: (E, F) Mann–Whitney U test. Boxplots whiskers indicate min and max, boxes indicate 25th and 75th percentiles, and central band indicates the median.
