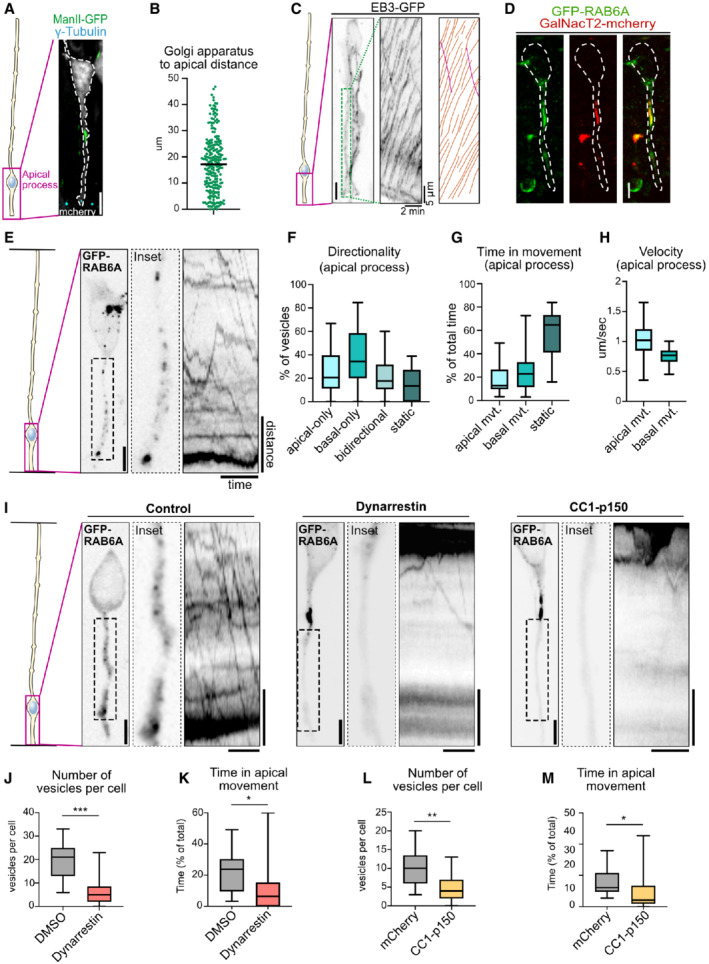
Figure 3. Apical transport of RAB6A+ post‐Golgi vesicles is driven by dynein.

-
ALocalization of the Golgi apparatus (ManII‐GFP) and the centrosome (γ‐tubulin) in E15.5 mCherry‐electroporated radial glial cell. The Golgi apparatus is localized basally, away from the centrosome. Scale bar = 5 μm.
-
BAverage distance between the apical most part of the Golgi apparatus and the apical surface in aRG cells. N = 224 cells from three independent brains.
-
CLive imaging of EB3‐GFP in the apical process of an aRG cell at E15.5. Center: kymograph. Left: manual tracking of EB3 comets. Orange: basally growing. Pink: Apically growing. Scale bar = 5 μm.
-
DCo‐expression of GFP‐RAB6A and GalNacT2‐mCherry in E15.5 aRG cells reveals colocalization at the Golgi apparatus. Scale bar = 5 μm. Dashed line: cell outline.
-
ELive imaging of GFP‐RAB6A in aRG cells at E15.5 allows tracking of individual RAB6A+ vesicles in situ, from the basal Golgi apparatus toward the apical surface. Scale bar = 5 μm. Distance = 5 μm, time = 30 s.
-
FRAB6A+ vesicle directionality in apical processes of aRG cells over 1‐min movies.
-
GRelative time spent by RAB6A+ vesicles in apical, basal, or static phases.
-
HVelocity of apically and basally moving RAB6A+ vesicles.
-
II Live imaging of GFP‐RAB6A in control, dynarrestin‐treated, and CC1‐p150‐expressing aRG cells at E15.5. Scale bars = 5 μm. Distance = 5 μm, time = 30 s.
-
JNumber of RAB6A+ vesicles in the apical process of DMSO and dynarrestin‐treated mouse aRG cells.
-
KRelative time spent by RAB6A+ vesicles in apical movement phase, in DMSO and dynarrestin‐treated mouse aRG cells.
-
LNumber of RAB6A+ vesicles in the apical process of mCherry and CC1‐p150‐expressing aRG cells.
-
MRelative time spent by RAB6A+ vesicles in apical movement phase, in mCherry and CC1‐p150‐expressing aRG cells. DMSO treatment slightly affected RAB6A dynamics, as compared to mCherry control.
Data information: (F, G, H) N = 388 vesicles from 30 cells. (J, K, L, M) 216 vesicles from N = 11 cells for DMSO, 145 vesicles from N = 25 cells for dynarrestin, 173 vesicles from N = 17 cells for mCherry control, 71 vesicles from N = 15 cells for CC1‐p150. Mann–Whitney U test *P ≤ 0.05, **P ≤ 0.01, ***P ≤ 0.001. All boxplots: whiskers indicate min and max, boxes indicate 25th and 75th percentiles, and central band indicates the median.
