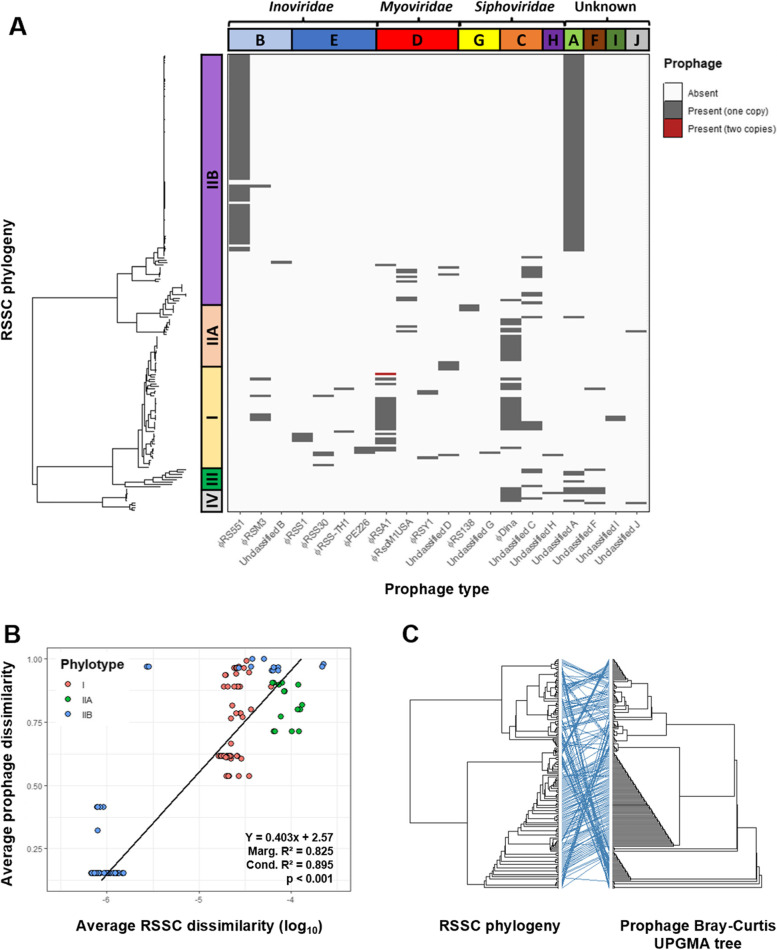
Fig. 5.
Prophages are phylotype-specific and have diversity proportional to the genetic diversity of their hosts. a Maximum likelihood tree of RSSC isolates from phylotypes I, IIA, IIB, III, and IV rooted and annotated with prophage presence (dark grey) and absence (white). Coloured bars on left show phylotype clustering within RSSC tree. Coloured bars on top show prophage clusters, labelled with phage families. b Average RSSC dissimilarity (log-transformed), measured using average pairwise Mash distances, versus average prophage dissimilarity, measured using average pairwise prophage Bray–Curtis distances. Points are coloured by phylotype. Bottom-right box shows regression equation, marginal and conditional R2 statistics, and p-value. Regression line is plotted. c Tanglegram of RSSC maximum likelihood tree and prophage Bray–Curtis UPGMA tree. Blue lines connect the same labels on each tree with horizontal lines supporting tree congruence and crossed lines indicating tree incongruence

