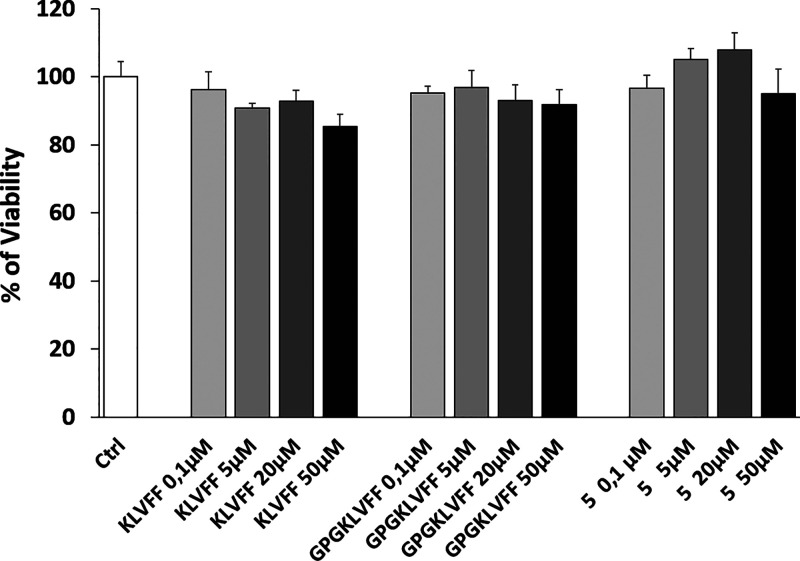
Figure 9.
MTT assay was performed on differentiated SH-SY5Y cells after 24 h treatments. Cells were exposed to increasing concentrations of 5 (0.1, 5, 20, 50 μM). Cells were also treated with the same concentrations of appropriate controls (KLVFF or GPGKLVFF). Bars represent means of three independent experiments with n = 5.

