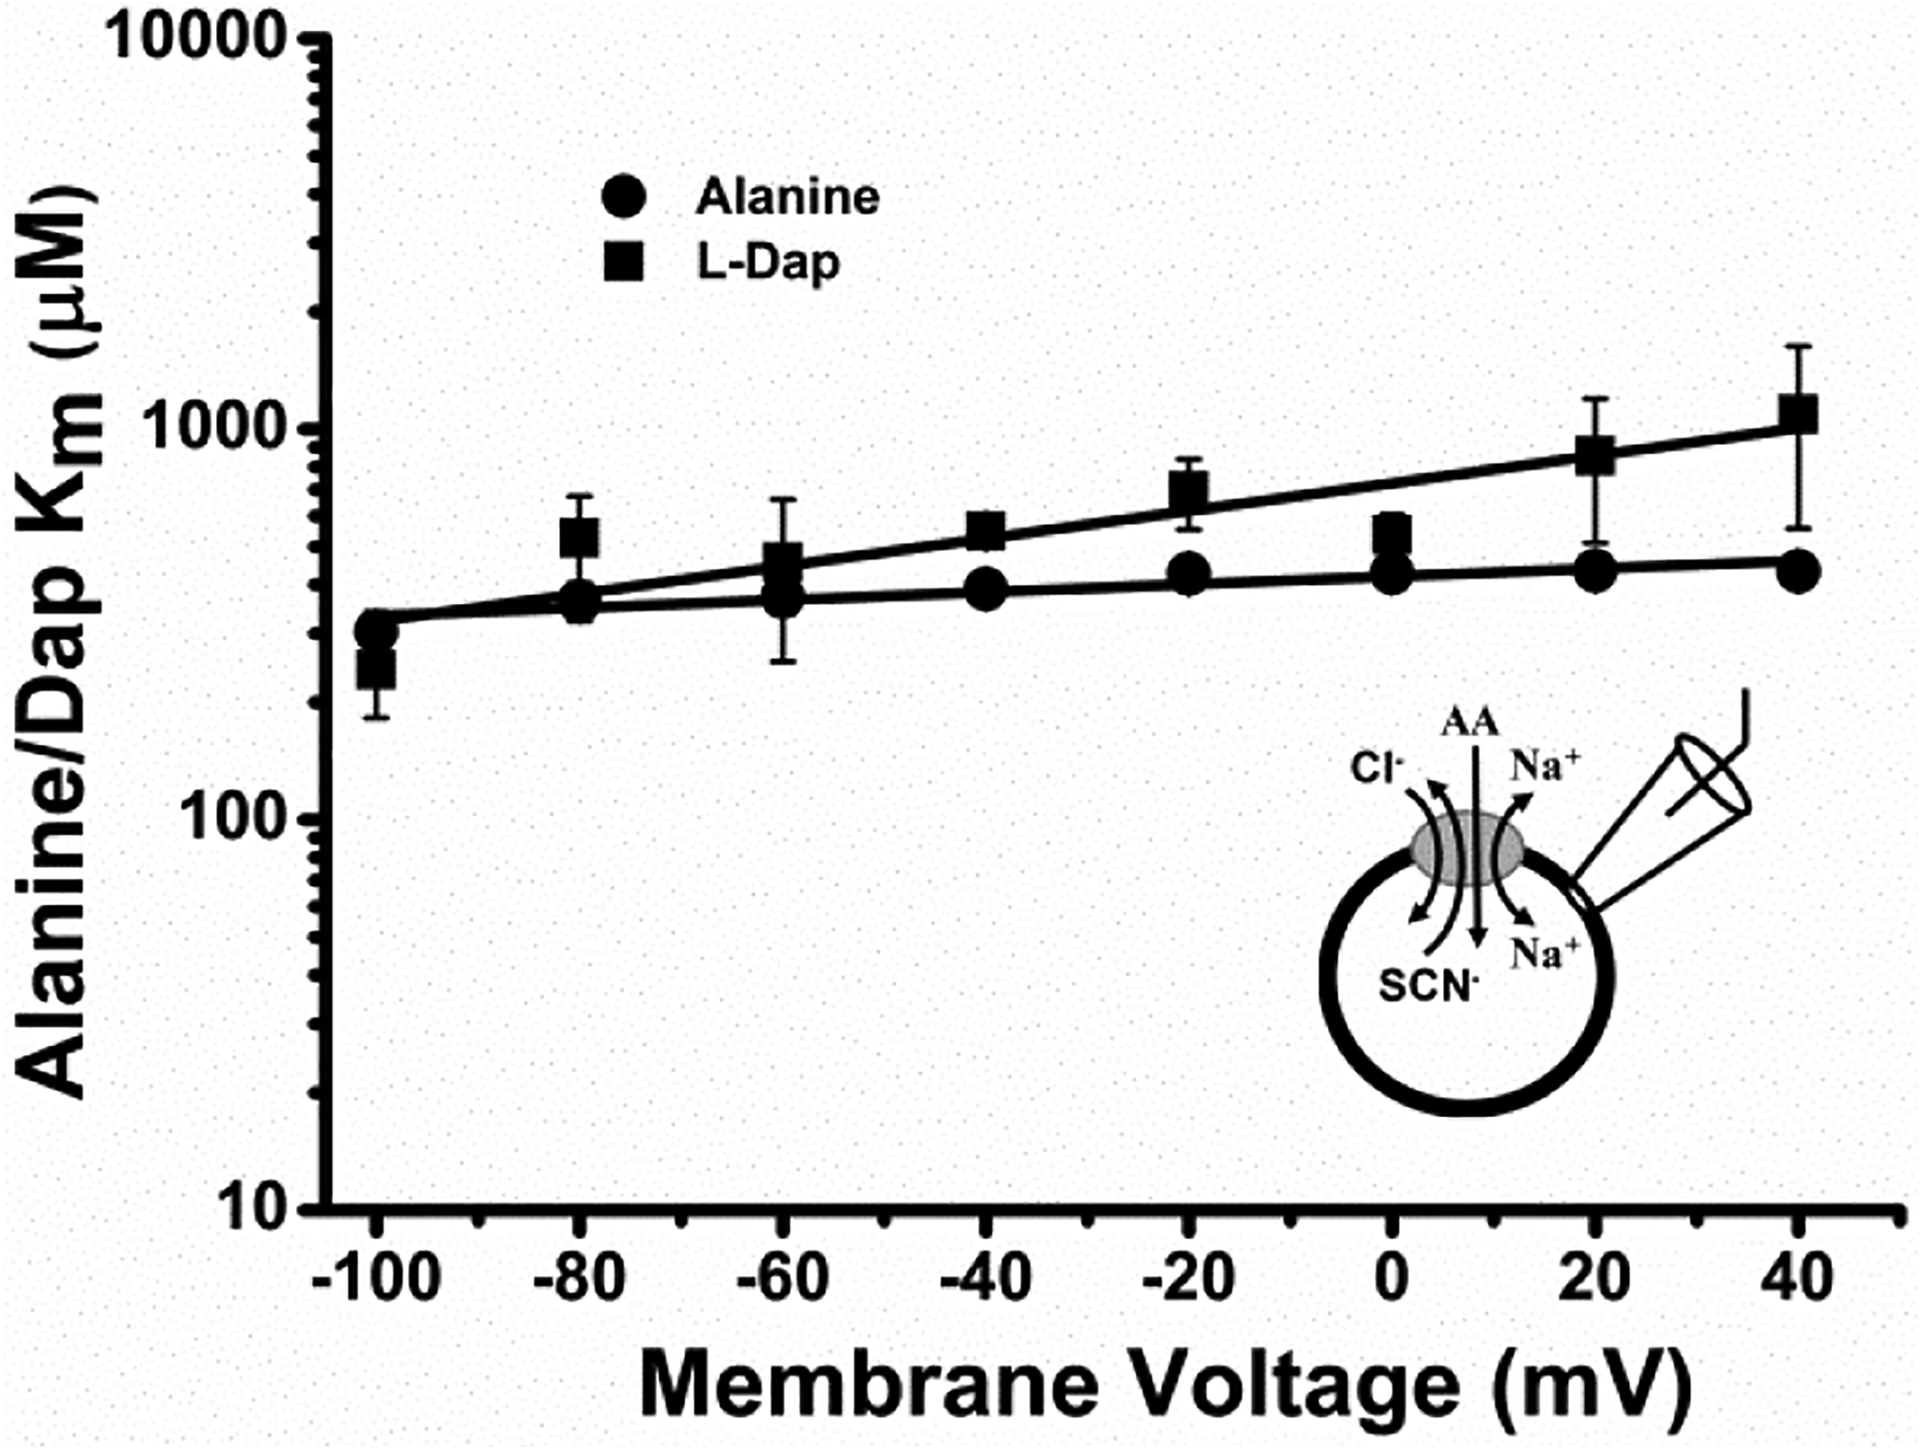
Figure 6: L-DAP binding senses the transmembrane electric field.

Voltage dependence of alanine and DAP binding affinities (Km) generated by the application of various concentrations of alanine (circles) and L-DAP (squares) to ASCT2-expressing cells in the presence of extracellular 140 mM NaCl and intracellular 130 mM NaSCN. The lines represent the result from a linear regression analysis, with a slope of 0.001 ± 0.0002 / mV for alanine and 0.004 ± 0.0008 / mV for DA. For alanine, Pearson’s r, R2 values were 0.908 and 0.796 respectively while DAP had Pearson’s r, R2 values of 0.886 and 0.748 respectively.
