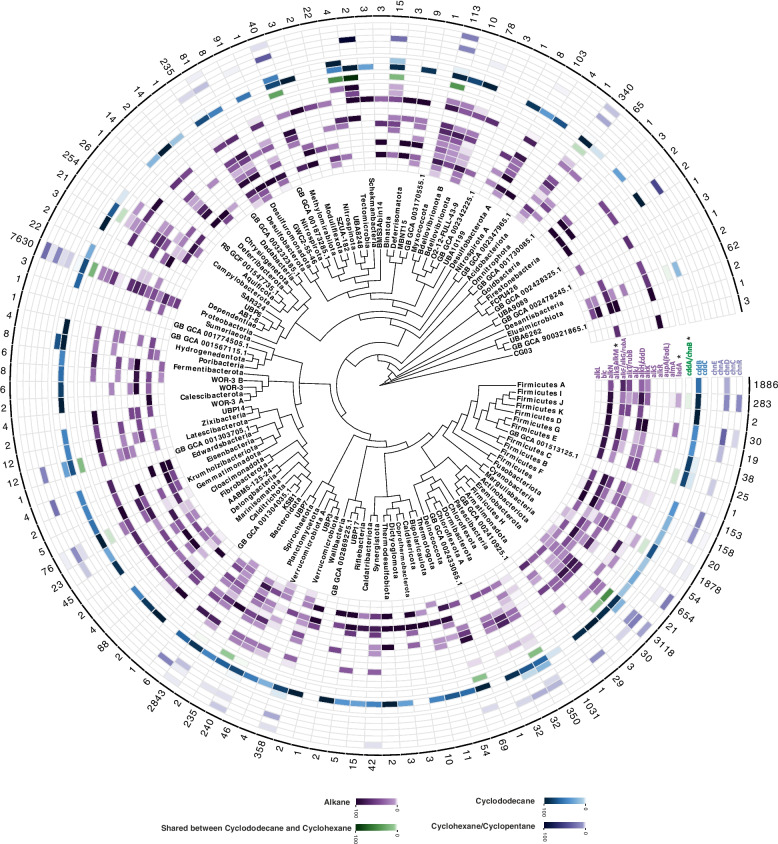
Fig. 1.
Distribution of aliphatic hydrocarbon-degrading genes across domain bacteria at phylum level. Each circle of the heatmap represents a gene involved in HC degradation. Various compounds are shown in different colors, as represented in the color legend at the bottom of the figure. Genes marked with an asterisk represent key enzymes of the degradation pathway. Numbers written on each row's edge indicate the number of screened genomes in that phylum in the AnnoTree website (adopted from GTDB R89). The color gradient for genes of each compound indicates the percentage of HC degrading members of each phylum

