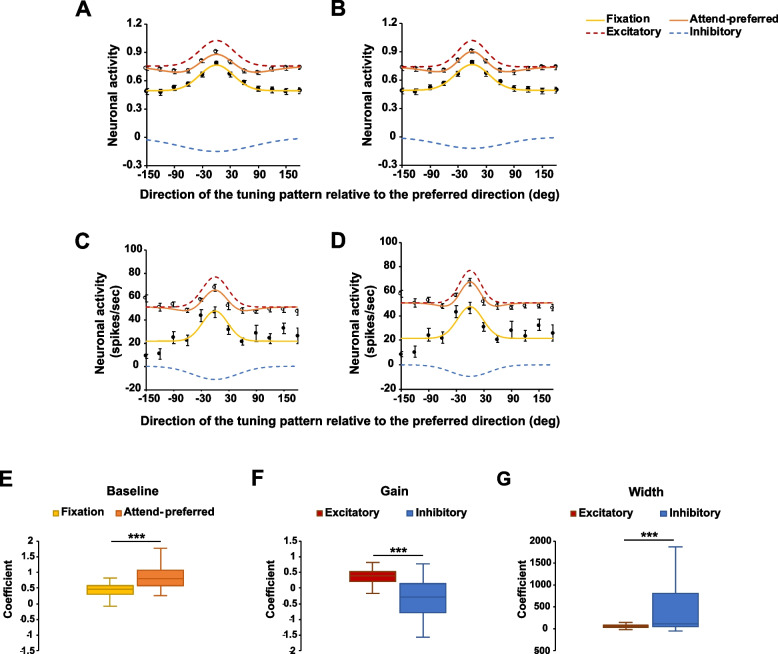
Fig. 4.
A,B Model fits to the averaged normalized neuronal responses (population level, n = 78). Outlined circles and filled circles indicate the data in the attend-preferred condition and in the fixation condition, respectively. A For the sum of two Gaussians model in the attend-preferred condition, coefficients of the excitatory Gaussian (gain and width) were the same as those of the single Gaussian model in the fixation condition. B All coefficients of the sum of two Gaussians model were free to vary. C,D Examples of the model fits to individual neuronal responses. In C, the coefficients of the excitatory Gaussian were constrained while they were unconstrained in D. E–G Median coefficients of the model fits to the normalized individual neuronal data (n = 69). E Baseline coefficients when the single Gaussian model fit the data in the fixation condition and when the sum of two Gaussians model fit the data in the attend-preferred condition. F Gain and G width coefficients of the excitatory and inhibitory Gaussians when the sum of two Gaussians model fit the data in the attend-preferred condition. Note that the gain coefficients of the excitatory Gaussian were the same as those of the single Gaussian fits in the fixation condition. Error bars indicate SEM. *** p < . 001

