Figure 2.
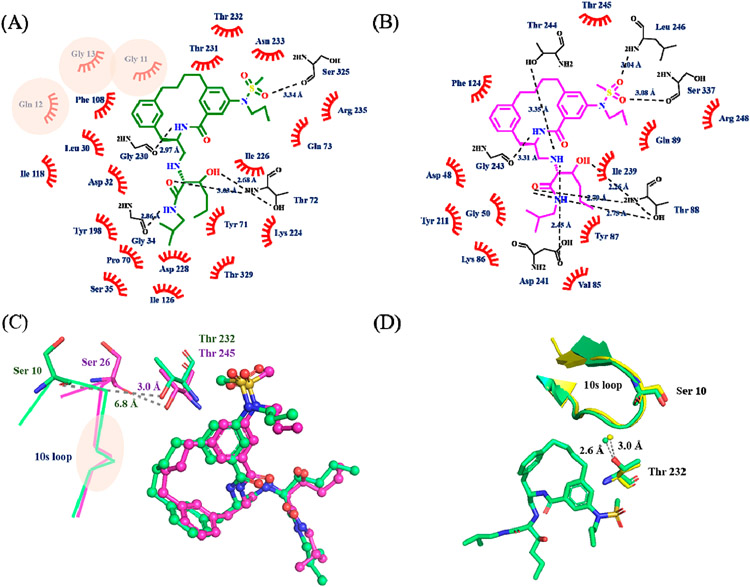
Ligand interaction plot of inhibitor 3 with (A) BACE1 and (B) BACE2. The plots are adapted from the output of LIGPLOT. The original plots are shown in Figure S6. Inhibitor 3 is shown in green (BACE1) and magenta (BACE2) line structures, and the non-carbon atoms are colored according to the atom types. The polar contacts are indicated by the dash lines with distances shown in angstroms, and the interacting residues are represented as black line. The residues involved in the hydrophobic interactions are labeled and shown as red hashes. Residues involved in BACE1 specific hydrophobic interactions are highlighted with pink circles. (C) Overlay of inhibitor 3 in the active site of BACE1 (green) and BACE2 (magenta). Inhibitor 3 is shown in ball and stick and colored according to the atom types. The 10s loop is labeled and shown as lines. Ser10 (Ser26 in BACE2) and Thr232 (Thr245 in BACE2) are shown in stick and colored based on atom types. The distance from the hydroxyl side chain of Thr232 (Thr245 in BACE2) to the carbonyl oxygen of Ser10 (Ser26 in BACE2) is shown in angstroms. The location of the residues involved in BACE1 specific interactions are highlighted within the pink circle (GQG in 10s loop). See also panel A and Figure S7. (D) Open conformation of 10s loop (shown as a ribbon representation) in unbound BACE1 (PDB: 3TPJ, colored in yellow) and inhibitor 3 bound BACE1 (PDB: 6NV9, colored in green). Ser10, Thr232, inhibitor 3, and an ordered water molecule are shown in ball and stick. The distance between the ordered water and the hydroxyl side chain of Thr232 is shown in angstroms.

