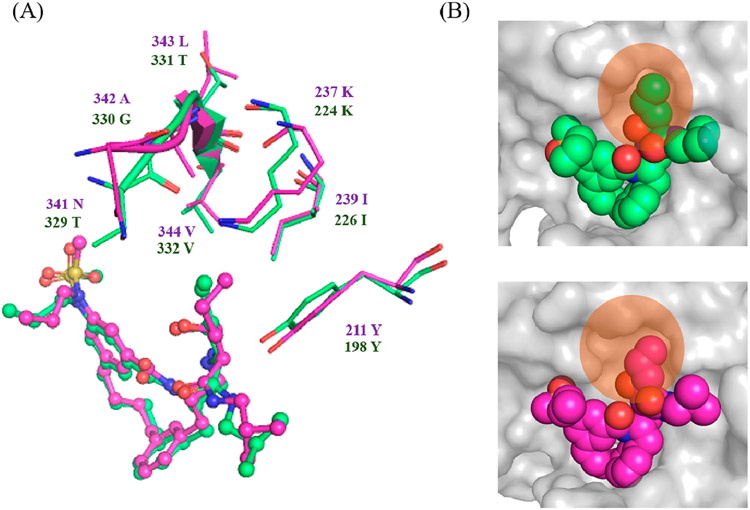
Figure 3.
(A) Overlay of inhibitor 3 in the active site of BACE1 (green) and BACE2 (magenta). The set of amino acid residues surrounding the S1′ binding pocket are shown as stick structures. Loop Thr329–Val332 in BACE1 and Asn341–Val344 are shown in ribbon. (B) Closer view of the S1′ binding pocket in the active site of BACE1 (top) and BACE2 (bottom). BACE1 and BACE2 are shown in surface presentation and colored in gray. Flap-loop is removed for clarity. Inhibitor 3 is shown in sphere presentation and colored according to the atom types. The S1′ binding pocket in the active site of BACE1 and BACE2 is highlighted with orange circles.

