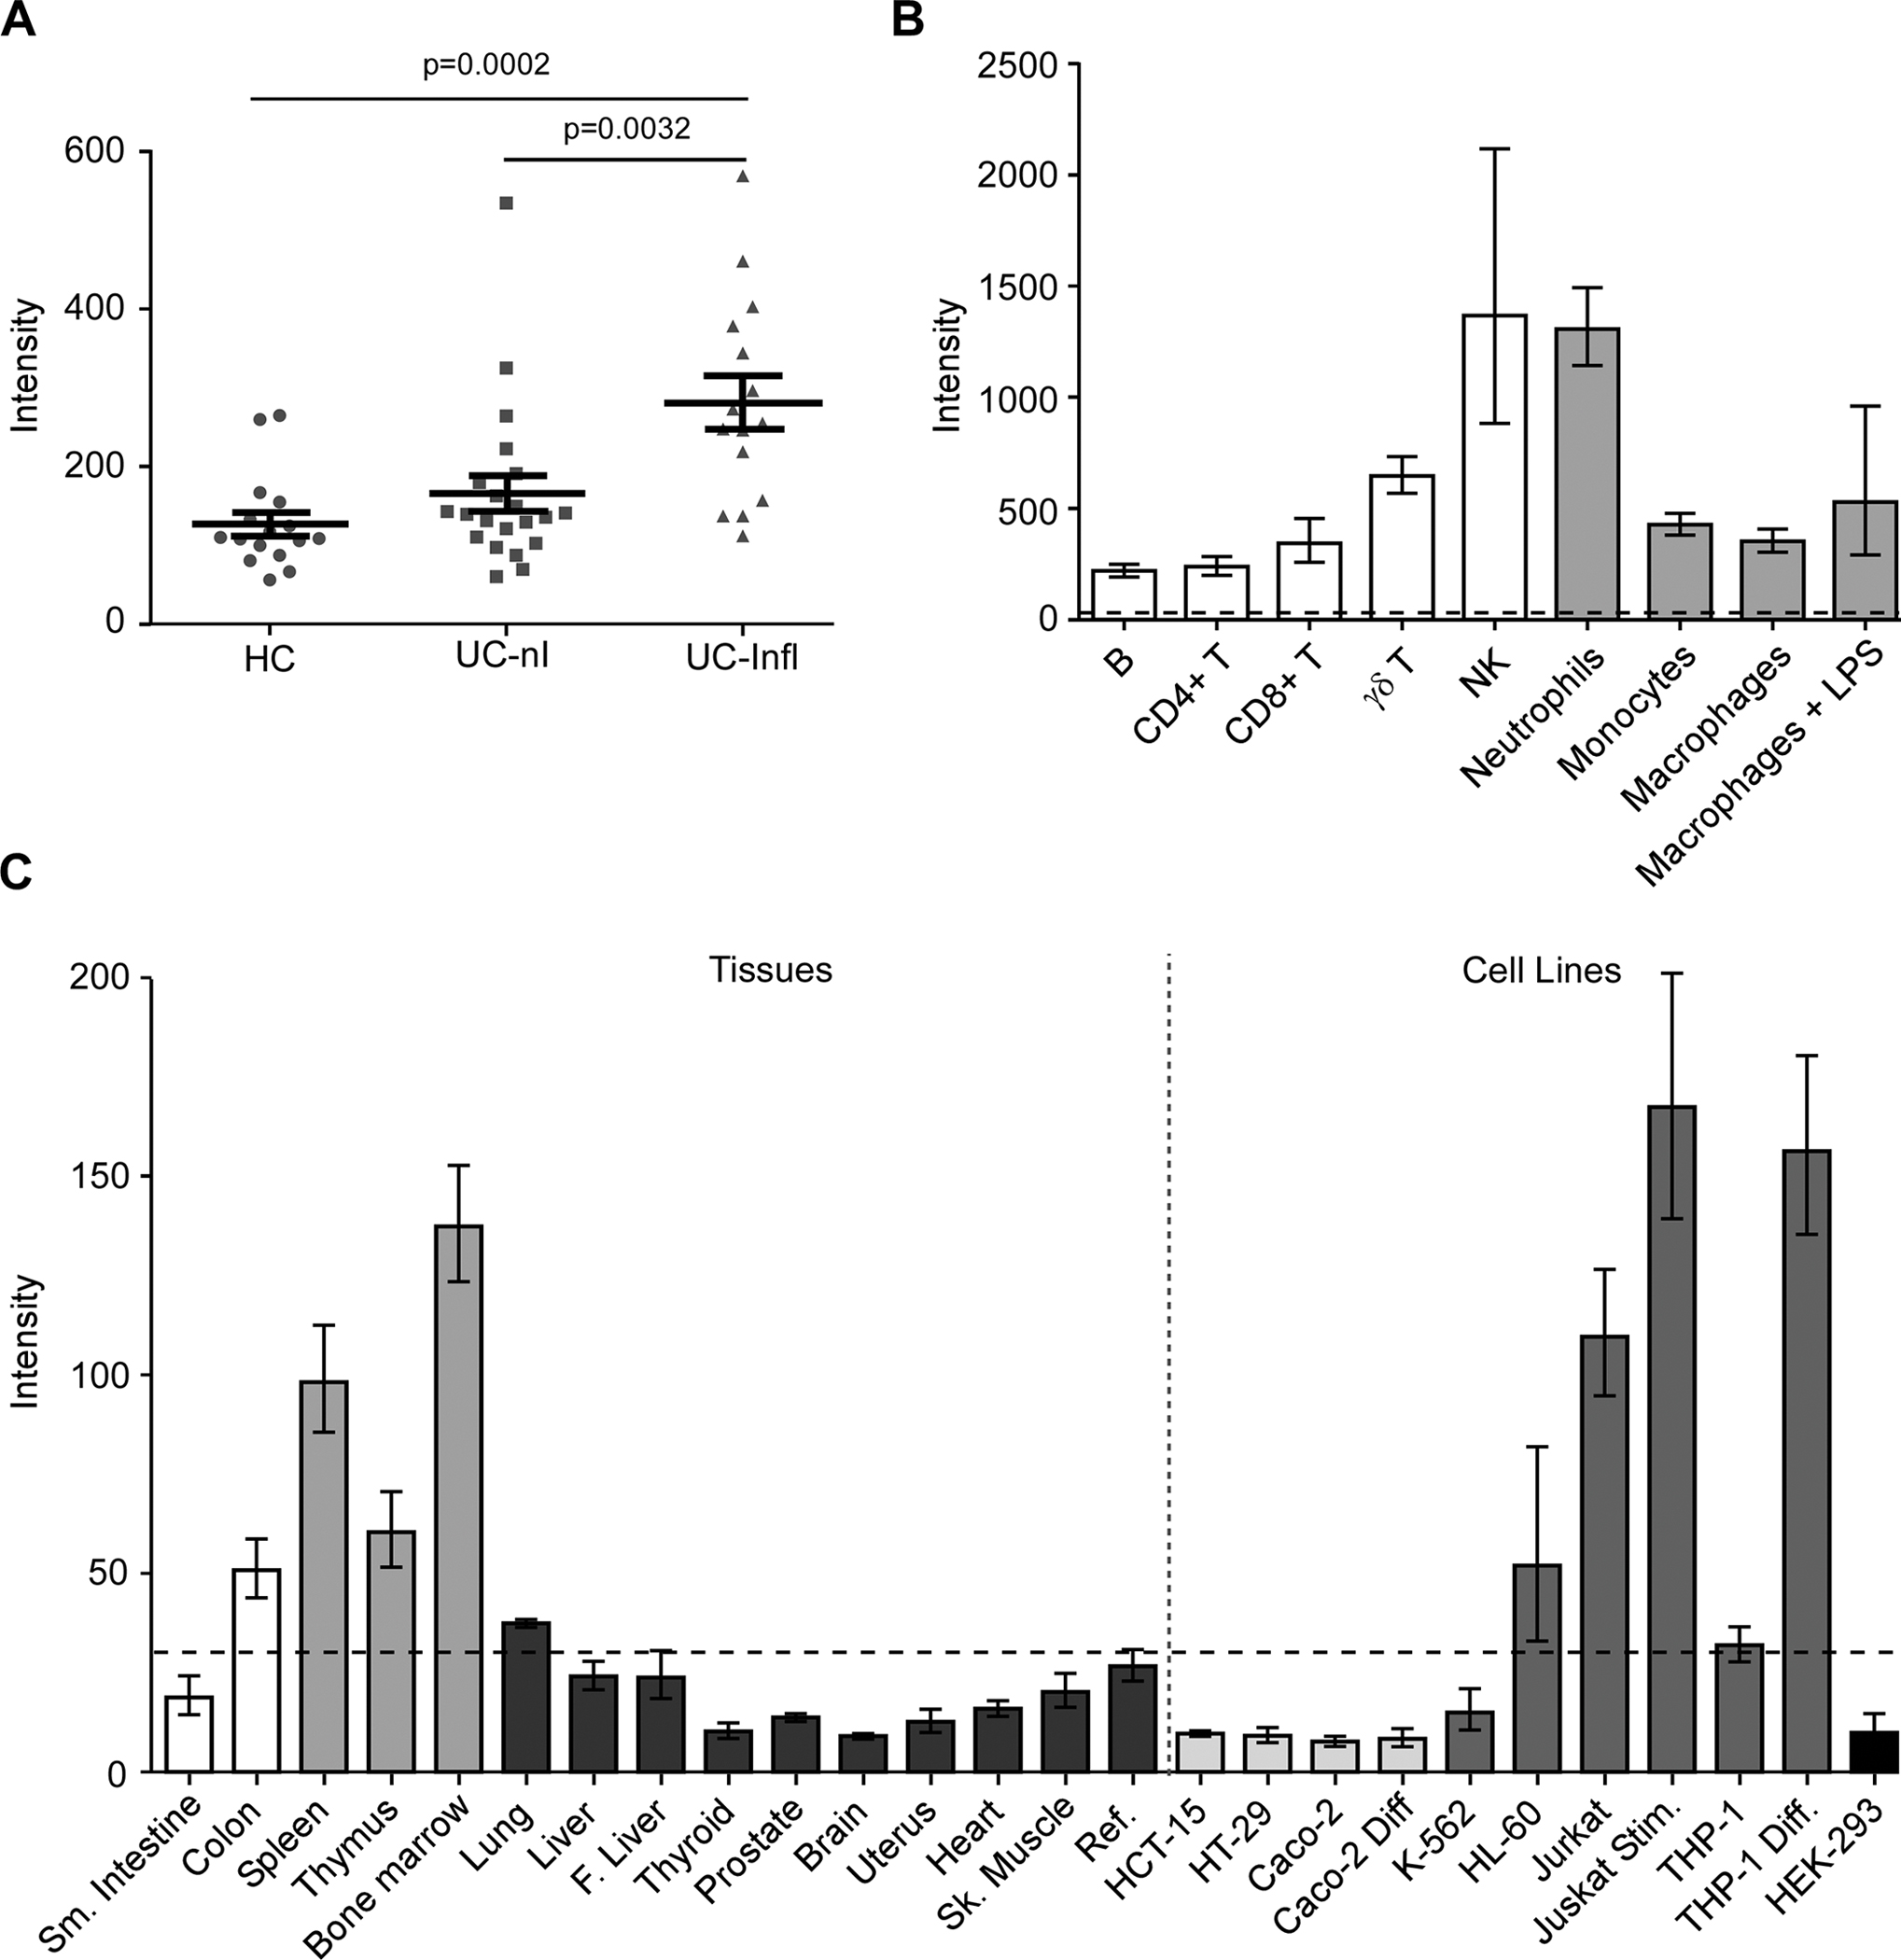
Fig. 4 -. Expression profiling of GPR65 suggests that its role in IBD is primarily mediated by immune cells.

(A) GPR65 expression in biopsies from healthy controls (HC, ●), UC patients in non-inflamed tissues (UC-nI, ■) or inflamed tissues (UC-Infl, ▲) measured using the Human Genome U133 Plus 2.0 Array (Affymetrix). The lines in panel A represent the mean and SEM of each group. P values (p) were calculated using a Student’s t test. For panel B and C, GPR65 expression was evaluated with a custom-made expression microarray (Agilent). (B) Gene expression in primary immune cells, cells were isolated from peripheral blood of healthy donors (n=6). Macrophages were generated in vitro following a seven-day treatment of monocytes with M-CSF (Millipore, Cedarlane, 50 ng/mL). Macrophage activation was achieved by a one-day treatment with 1 μg/mL LPS (macrophages + LPS) for a total incubation period of eight days. Barplots represent geometric mean with SE. (C) Expression levels of GPR65 in a panel of human tissues (bone marrow, heart, skeletal muscle, uterus, liver, fetal liver, spleen, thymus, thyroid, prostate, brain, lung, small intestine, and colon). Cell lines represent models of human T lymphocytes (Jurkat), monocytes (THP-1), erythroleukemia cells (K562), promyelocytic cells (HL-60), colonic epithelial cells (HCT-15, HT-29, Caco-2), and cells from embryonic kidney (HEK 293). For gene expression in immortalized cell lines, a differentiation model of colonic epithelium was obtained by culture of Caco-2 cells after 21 days of confluence. Jurkat cells were stimulated using 40 ng/mL PMA and 1 μg/mL ionomycin (Millipore Sigma) for 6 hours (Jurkat Stim) and THP-1 cells were differentiated using 10 ng/mL TNFα and 400 U/mL IFNγ (Biolegend, Cedarlane) for 24 hours (THP-1 Diff). Intensity values for each tissue/cell line represent the geometric mean with geometric standard deviation of 3 independent (technical) measurements; each measurement represents the geometric mean of all probes (one per exon) for each gene followed by a median normalization across all genes on the array. Dotted line indicates the threshold level for detection of basal expression. The reference sample is composed of a mixture of RNAs derived from 10 different human tissues.
