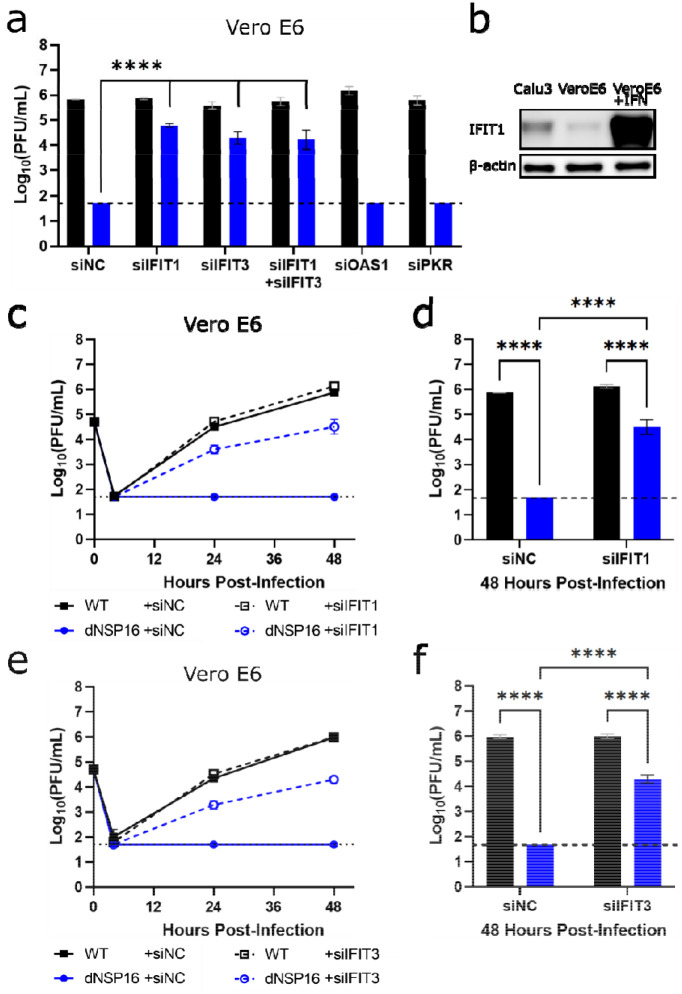
Figure 5. Knockdown of IFIT genes partially reverses attenuation of dNSP16.
(a) Replication of WT (black) and dNSP16 (blue) in the context of siRNA treatment. 1.25 × 10⁵ Vero E6 cells/well were reverse transfected with 2 pmol total of the indicated siRNA construct(s) 2 days prior to infection and also pre-treated with 100 U IFN-I a day prior to infection, multiplicity of infection (MOI) = 0.01. Data shown at 48 hours post-infection (HPI). Statistical comparisons on graph are with respect to siRNA control treatment (“siNC”). (b) Baseline IFIT1 protein expression in Calu-3 2B4 and Vero E6 cells, or Vero E6 cells 1 day post-stimulation with IFN-I. (c) Viral replication kinetics for WT (black) or dNSP16 (blue) following treatment with anti-IFIT1 (dashed) or control siRNA (solid). 1.25 × 10⁵ Vero E6 cells were reverse transfected with 1 pmol of the indicated siRNA construct 2 days prior to infection and also pre-treated with 100 U IFN-I a day prior to infection, MOI = 0.01. (d) Comparison of the viral titers at 48 HPI from panel (c), black = WT, blue = dNSP16. (e) Viral replication kinetics for WT (black) or dNSP16 (blue) following treatment with anti-IFIT3 (dashed) or control siRNA (solid). 1.25 × 10⁵ Vero E6 cells/well were transfected with 1 pmol of the indicated siRNA construct 2 days prior to infection and also pre-treated with 100 U IFN-I a day prior to infection, MOI = 0.01. (f) Comparison of the viral titers at 48 HPI from panel (e), black = WT, blue = dNSP16. For panels (a), (d) and (f), ****p<0.001: results of two-way ANOVA with Tukey’s multiple comparison test (α = 0.05). Means are plotted with error bars denoting standard deviation. For all panels, n = 3 biological replicates for all data points. Dotted lines represent limits of detection. PFU = plaque-forming units.

