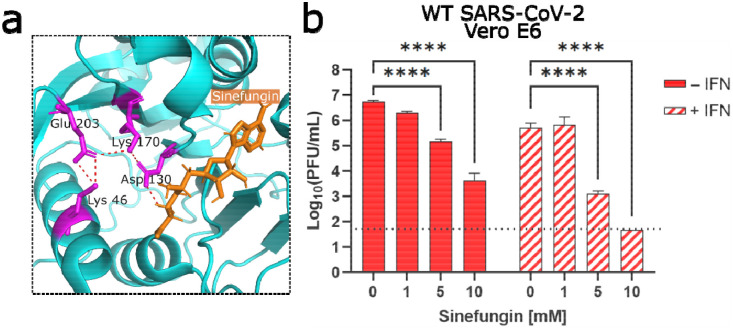
Figure 6. Targeting the NSP16 active site for antiviral treatment.
(a) Detail of structure of NSP16 in complex with sinefungin, from Protein Data Bank ID: 6YZ1 (37). The residues of the catalytic core are colored in magenta, sinefungin is colored in orange, and polar contacts are shown by orange dashed lines. (b) Dose-dependent effect of sinefungin on WT SARS-CoV-2 replication. 5 × 10⁴ Vero E6 cells/well were seeded in 24-well format one day before infection and also pre-treated with 100 U IFN-I 8 hours later. The day of infection (multiplicity of infection = 0.01), sinefungin was given at the indicated concentration 1 hour after infection (in cell culture media). Data shown at 48 HPI. ****p<0.001: results of two-way ANOVA with Tukey’s multiple comparison test (α = 0.05). Means are plotted with error bars denoting standard deviation. n = 3 biological replicates for all data points. PFU = plaque-forming units.

