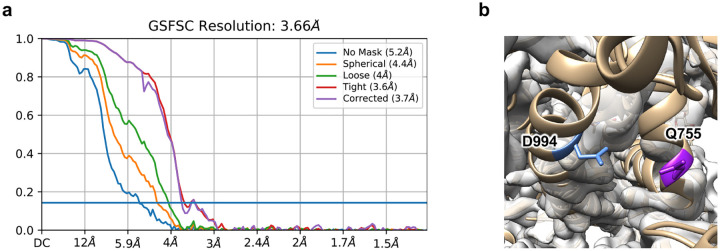
Extended Data Fig. 6 |. Cryo-EM structure validation and analysis.
a, Gold-standard Fourier shell correlation curve of soluble 2PQ ectodomain. b, Fit of cryo-EM density map of S with 2PQ mutations (in grey) to resolved structure of S with 2P mutations (PDB: 6VXX). Helices in 2PQ as indicated by the electron density map are closer compared to those in 2P. Contour level of density map was set to 0.2 in UCSF Chimera.

