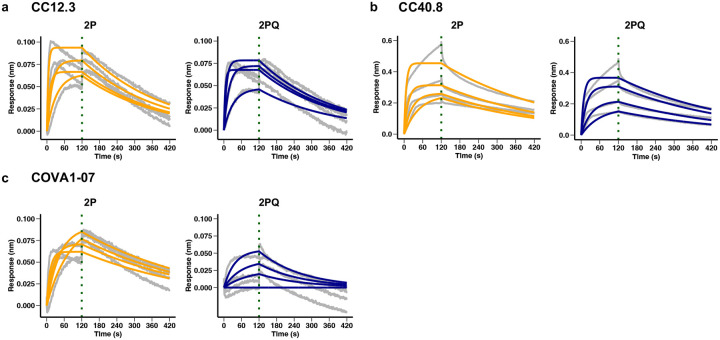
Extended Data Fig. 7 |. Binding kinetics of SARS-CoV-2 S antibodies to soluble 2P and 2PQ.
a-c, Sensorgrams for biolayer interferometry experiments to quantify binding kinetics of soluble 2P and 2PQ with CC12.3, an RBD antibody (a), CC40.8, an S2 stem helix antibody (b), and COVA1–07, an S2 HR1 antibody (c). Grey lines correspond to raw data. Orange (2P) and blue (2PQ) lines correspond to fitted curves. The green vertical dotted line marks the end of association step and the beginning of dissociation step. Source data are available.

