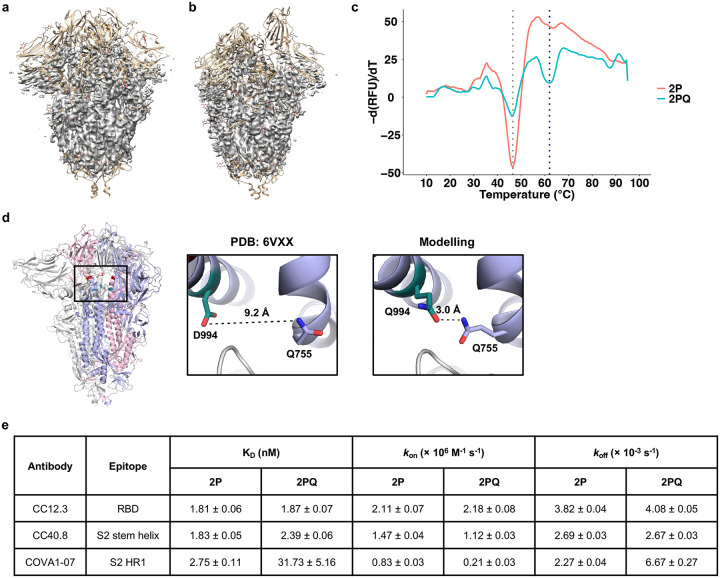
Fig. 4 |. Biophysical characterization of 2PQ spike.
a,b, Electron density map (colored grey) of 2PQ fitted on S with all-down RBD (PDB: 6VXX) (a), and one-up RBD (PDB: 6VYB) (b). c, The first differential curves for the relative fluorescence unit (RFU) from differential scanning fluorimetry with respect to temperature are shown for soluble 2PQ and 2P. Grey dotted line indicates the first apparent melting temperature (Tm) of 2P and 2PQ at approximately 46.5 °C; blue dotted line indicates the second apparent Tm of 2PQ at approximately 62 °C. d, D994Q allows formation of an additional intraprotomer hydrogen bond as shown by structural modelling. Distinct protomers are in grey, light blue and pink. The Q758 and Q994 side chains are shown as sticks representation. Hydrogen bond is indicated in black dashed line with the distance indicated. e, Summary of binding kinetics data from biolayer interferometry (BLI) experiments. Dissociation constants (KD), on-rates (kon) and off-rates (koff) are shown as mean ± standard error. Source data are available.

