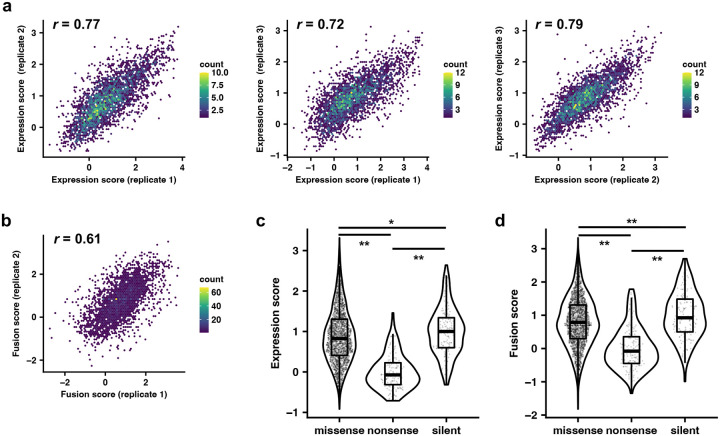
Extended Data Fig. 1 |. Additional analyses for expression and fusion assays.
a,b, Correlation of expression scores (a) and fusion scores (b) between replicates. Pearson correlation coefficient, r, is shown for each plot. c,d, Violin plots of expression scores (c) and fusion scores (d) of missense, nonsense, and silent mutations are compared. Box and whisker plots are also shown. *, p < 0.05; **, p < 0.001. Exact p-values from two-sided t test are shown in Supplementary Table 6. Source data are available as Supplementary Table 1.

