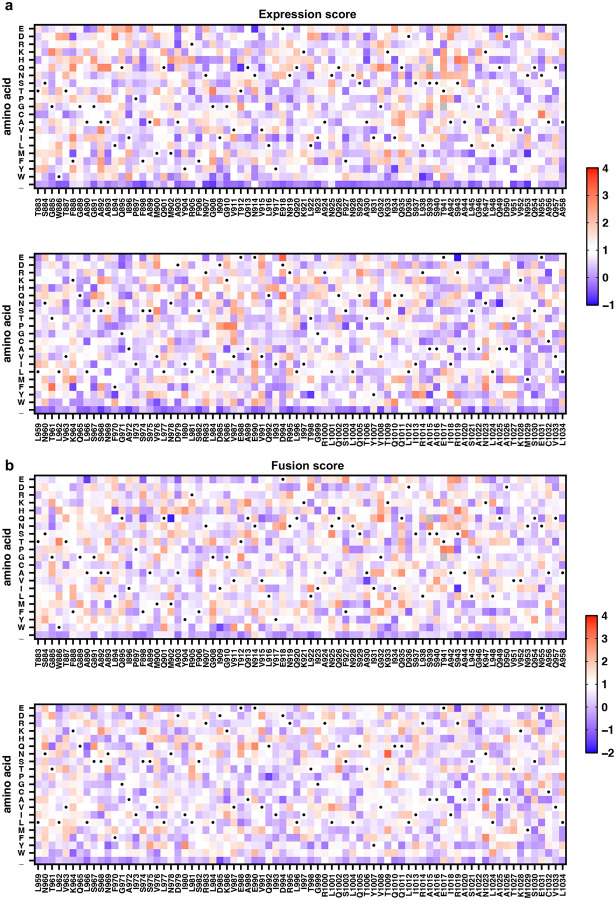
Extended Data Fig. 2 |. Heatmaps of expression and fusion scores.
a-b, Expression scores (a), and fusion scores (b) of all amino-acid mutations in the DMS library. Underscore (_) in amino acid represents a nonsense mutation. Dots indicate WT. Grey squares indicate mutations that were not observed. Expression and fusion scores shown are the mean of n = 3 and n = 2 independent replicates, respectively. Lower expression score implies lower surface expression of the S protein, whereas lower fusion score suggests fusogenicity is impaired. Abbreviations of amino acid residues are as follows: A, alanine; C, cysteine; D, aspartic acid; E, glutamic acid; F, phenylalanine; G, glycine; H, histidine; I, isoleucine; K, lysine; L, leucine; M, methionine; N, asparagine; P, proline; Q, glutamine; R, arginine; S, serine; T, threonine; V, valine; W, tryptophan; Y, tyrosine. Source data are available as Supplementary Table 1.

