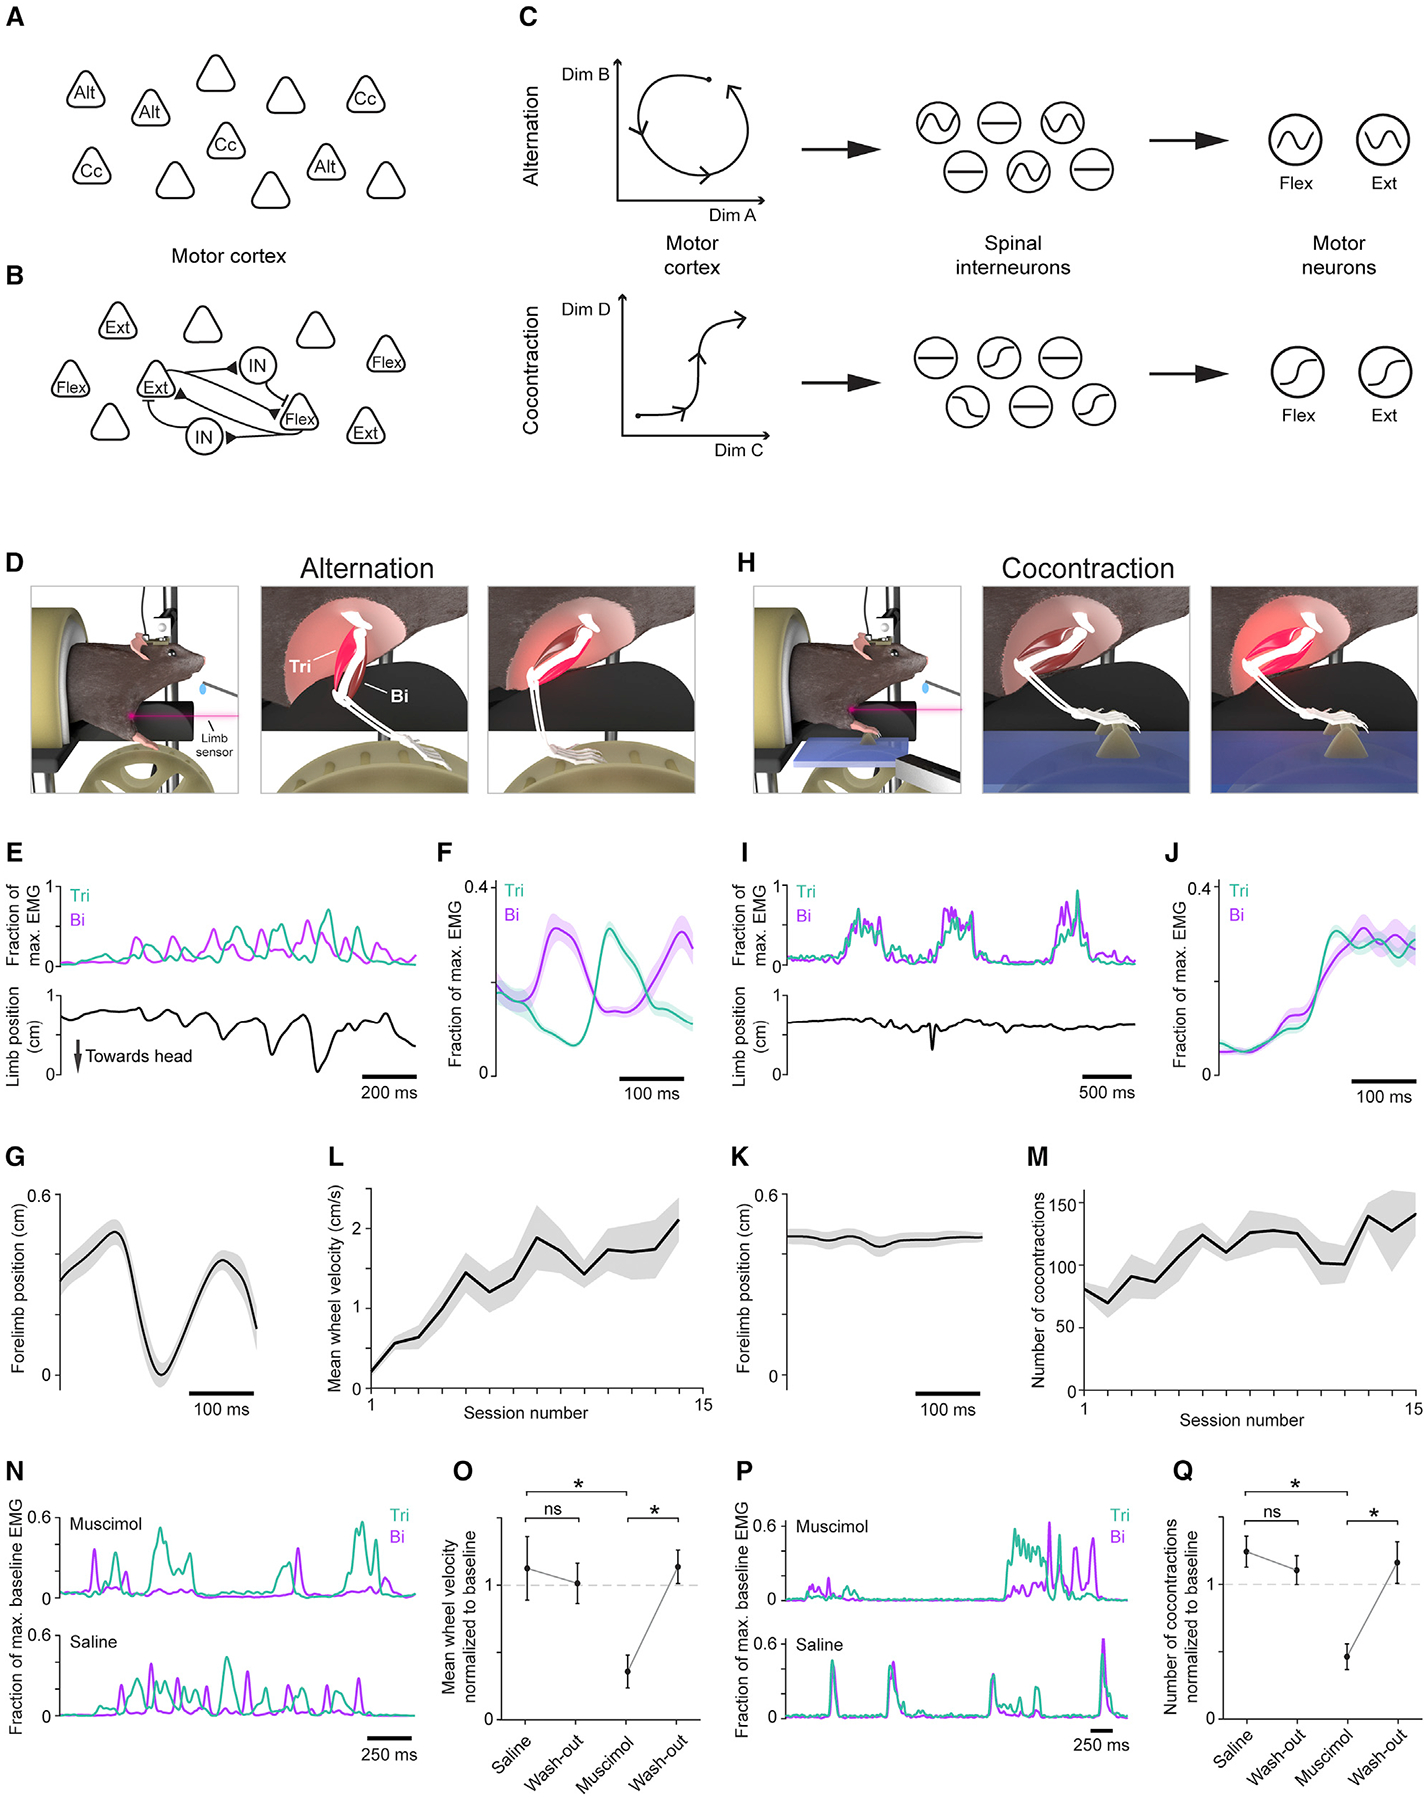
Figure 1. Alternation and cocontraction behavioral paradigm.

(A–C) Schematics depicting models in which motor cortex mediates cocontraction (Cc) and alternation (Alt) through task-specific pyramidal neurons (A), concurrent activation of flexion (Flex) and extension (Ext) related pyramidal neurons gated by interposed interneurons (B), or task-specific activity covariation (C).
(D and H) Schematic depicting the alternation (D) and cocontraction (H) tasks and associated muscle activity (bright red).
(E, F and I, J) EMG from triceps (Tri) and biceps (Bi) activity during the alternation (E–F) and cocontraction (I–J) tasks. (E) and (I) show example EMG time series with limb position below. (F) and (J) show trial-averaged EMG mean ± SEM (n = 30 trials) from an individual session.
(G, K) Trial-averaged limb position ± SEM (n = 30 trials) aligned to triceps onset from alternation (G) and cocontraction (K) epochs from the same time points as shown in (F) and (J), respectively.
(L and M) Mean ± SEM (n = 5 mice) of mean wheel velocity during alternation training (L) and number of cocontraction events during cocontraction training (M).
(N–Q) Examples of triceps (Tri) and biceps (Bi) activity after injection of muscimol (top) or saline (bottom) during alternation (N) and cocontraction (P). Mean ± SEM (n = 5 mice) for mean wheel velocity during alternation, normalized to baseline, which is defined as mean performance over the three sessions preceding injection (O; one-tailed paired t test: saline and wash-out p = 0.642, muscimol and wash-out p = 0.002, saline and muscimol p = 0.023) and cocontraction (Q; saline and wash-out p = 0.766, muscimol and wash-out p = 0.004, saline and muscimol p = 0.004).
