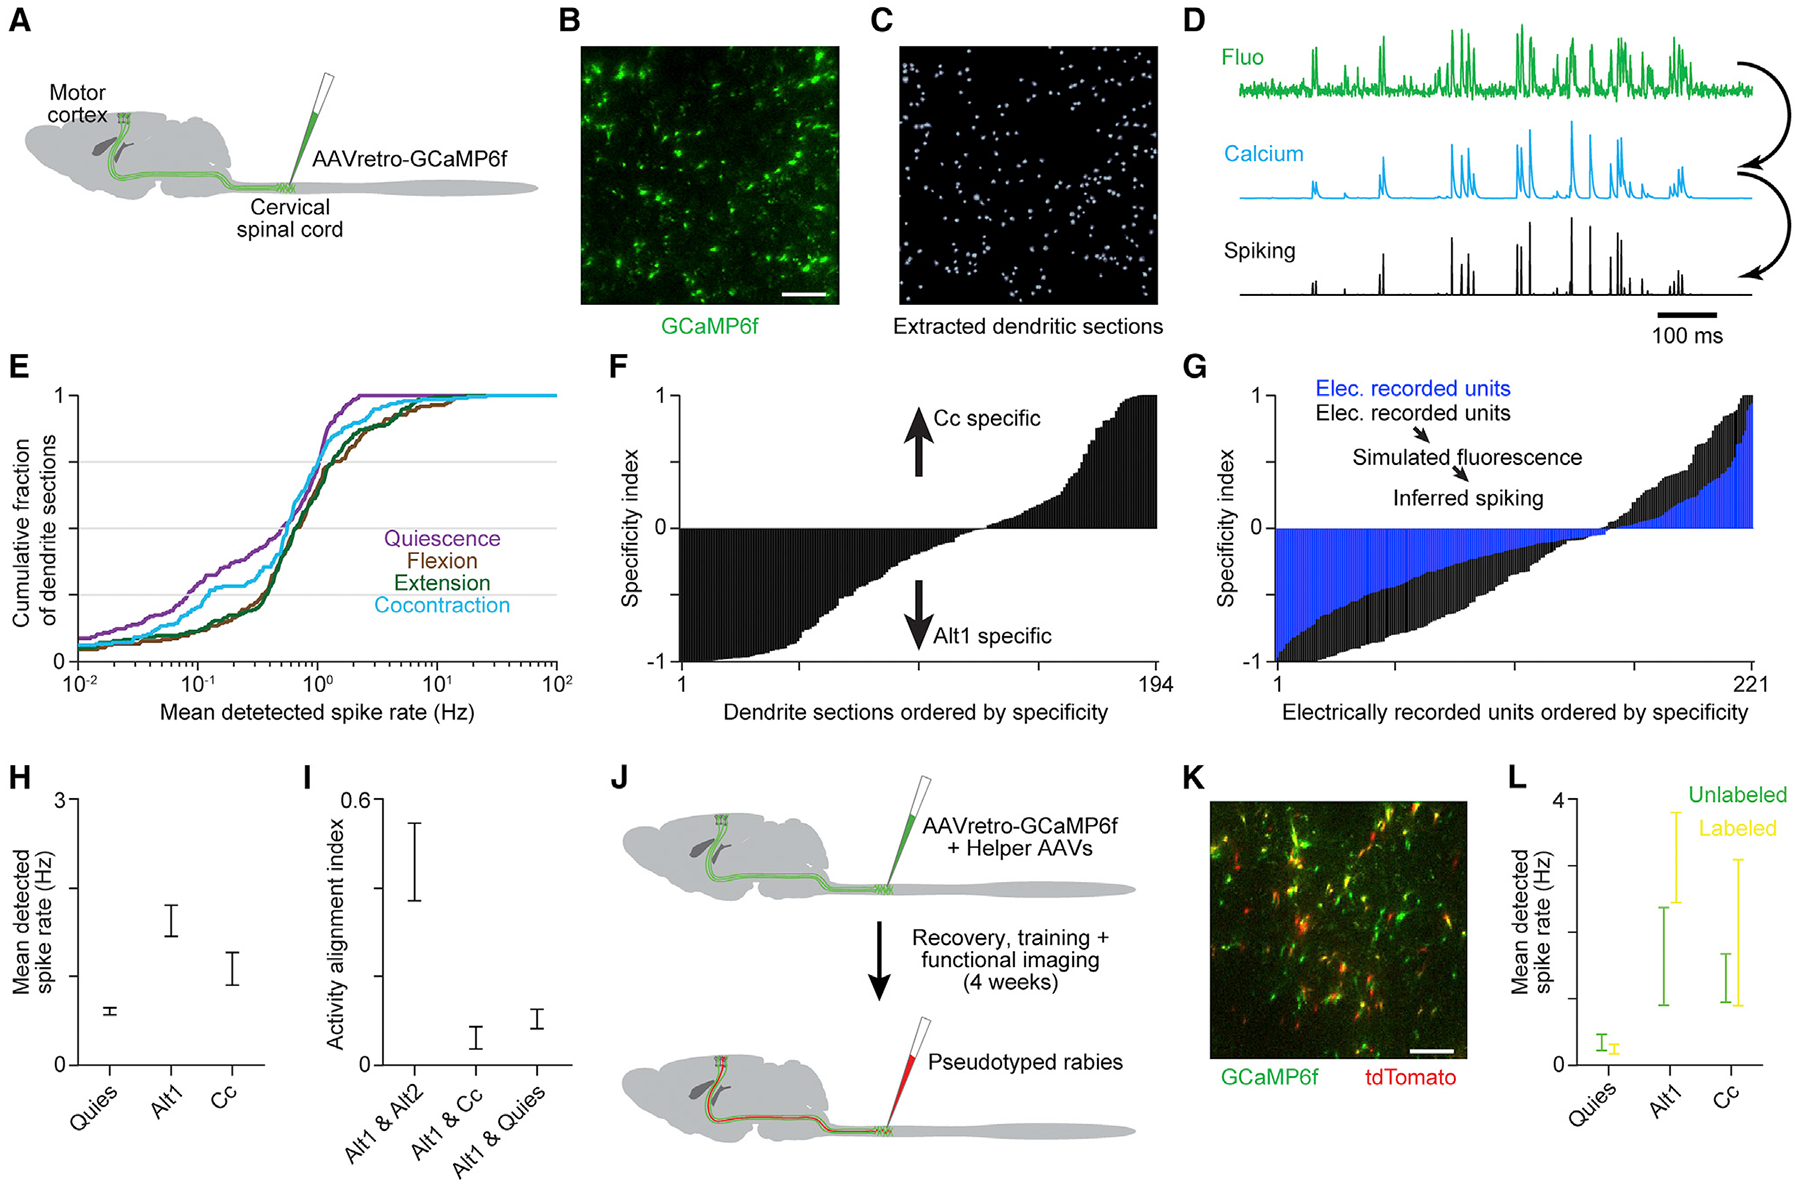
Figure 7. Corticospinal neuron activity during alternation and cocontraction.

(A) An rAAV2-retro was injected into cervical spinal segments to induce GCaMP6f expression in corticospinal neurons.
(B and C) Example of fluorescence (B) and dendritic cross-sections (C) from a horizontal imaging region ~350 μm below pia. Scale bar, 50 μm.
(D) Example fluorescence, estimated calcium change, and estimated spiking time series.
(E) Cumulative histogram of detected spike rates for qualifying dendritic sections during distinct behavioral epochs.
(F) Specificity index for qualifying dendritic sections, in ascending order.
(G) Specificity index for electrically recorded putative pyramidal neurons, and the same neurons after simulating calcium-sensitive fluorescence based on their spiking and inferring spiking from simulated fluorescence.
(H) Mean ± SEM detected spike rate across qualifying dendritic sections during distinct behavioral epochs.
(I) Mean ± SEM (n = 9 imaging planes) activity alignment for corticospinal dendritic sections.
(J) Schematic of injections for imaging experiments in which rabies-driven tdTomato labeling of GAD+ spinal neuron-contacting corticospinal neurons was registered to GCaMP6f after functional measurements were completed.
(K) Example of GCaMPf and tdTomato fluorescence from a horizontal imaging region. Scale bar, 50 μm.
(L) Mean ± SEM for tdTomato-labeled (n = 28) and unlabeled (n = 19) dendritic sections during quiescence, alternation, and cocontraction. Neither group showed significant changes between alternation and cocontraction (two-tailed t test, p > 0.05).
