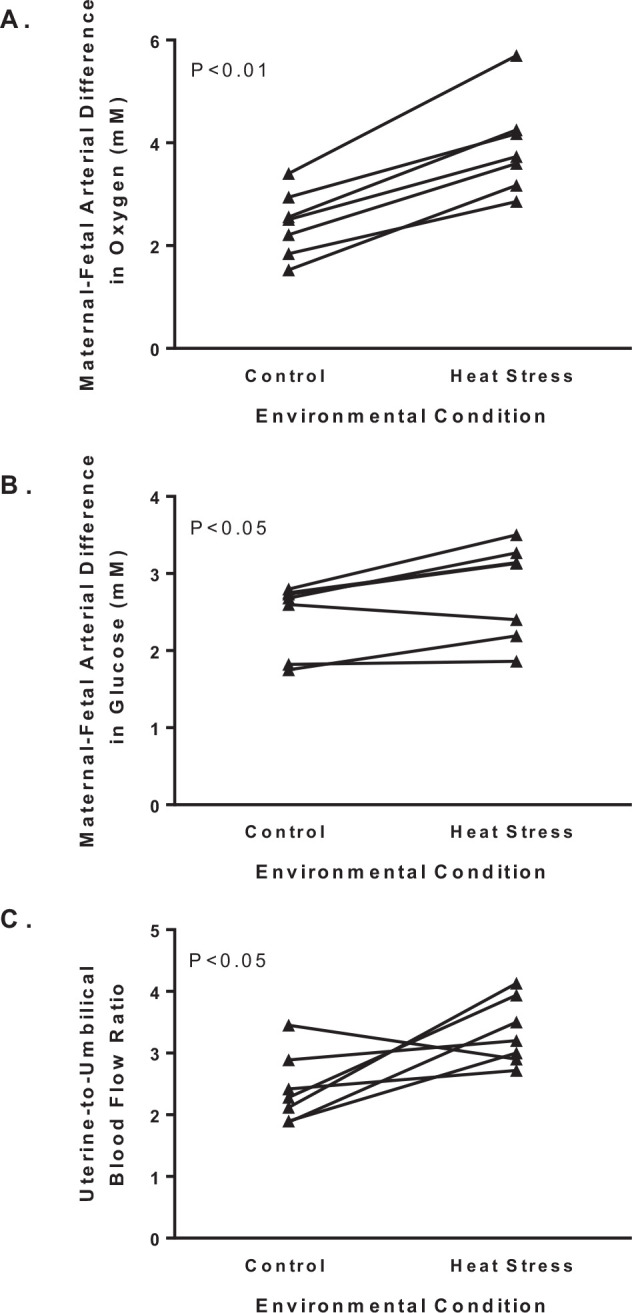
Figure 3. Transplacental gradients and uterine-umbilical blood flow ratio. Maternal- fetal arterial difference for oxygen (A) and glucose (B) concentrations are presented for pregnant ewes at approximately 90% of gestation. Uterine-to-umbilical blood flow rates are presented in panel C. Group means for thermoneutral control and heat stressed ewes were reported in Bell et al., 1987; Thureen et al., 1992; Ross et al., 1996; Anderson et al., 1997; Regnault et al., 2003; Limesand et al., 2004, 2007; de Vrijer et al., 2004. An ANOVA with report as the repeated measure identifies group (control and heat stress) differences (P-values).

