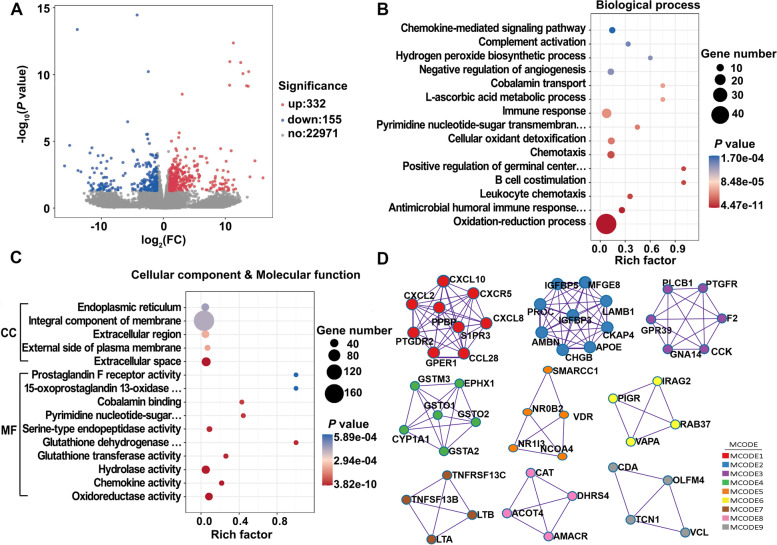
Fig. 5.
The GO enrichment analysis and protein–protein interactions network of DEGs. A Volcano plot of DEGs; fold-changes were calculated as CON treatment/LFM treatment. B The top 15 terms in the biological process category. C The top 5 terms in the cellular component category and the top 10 terms in the molecular function category. D Protein–protein interactions network among DEGs analysed by Metascape identifies nine protein communities. Results are based on RNA sequencing from 4 random samples in 6 biological replicates for each group

