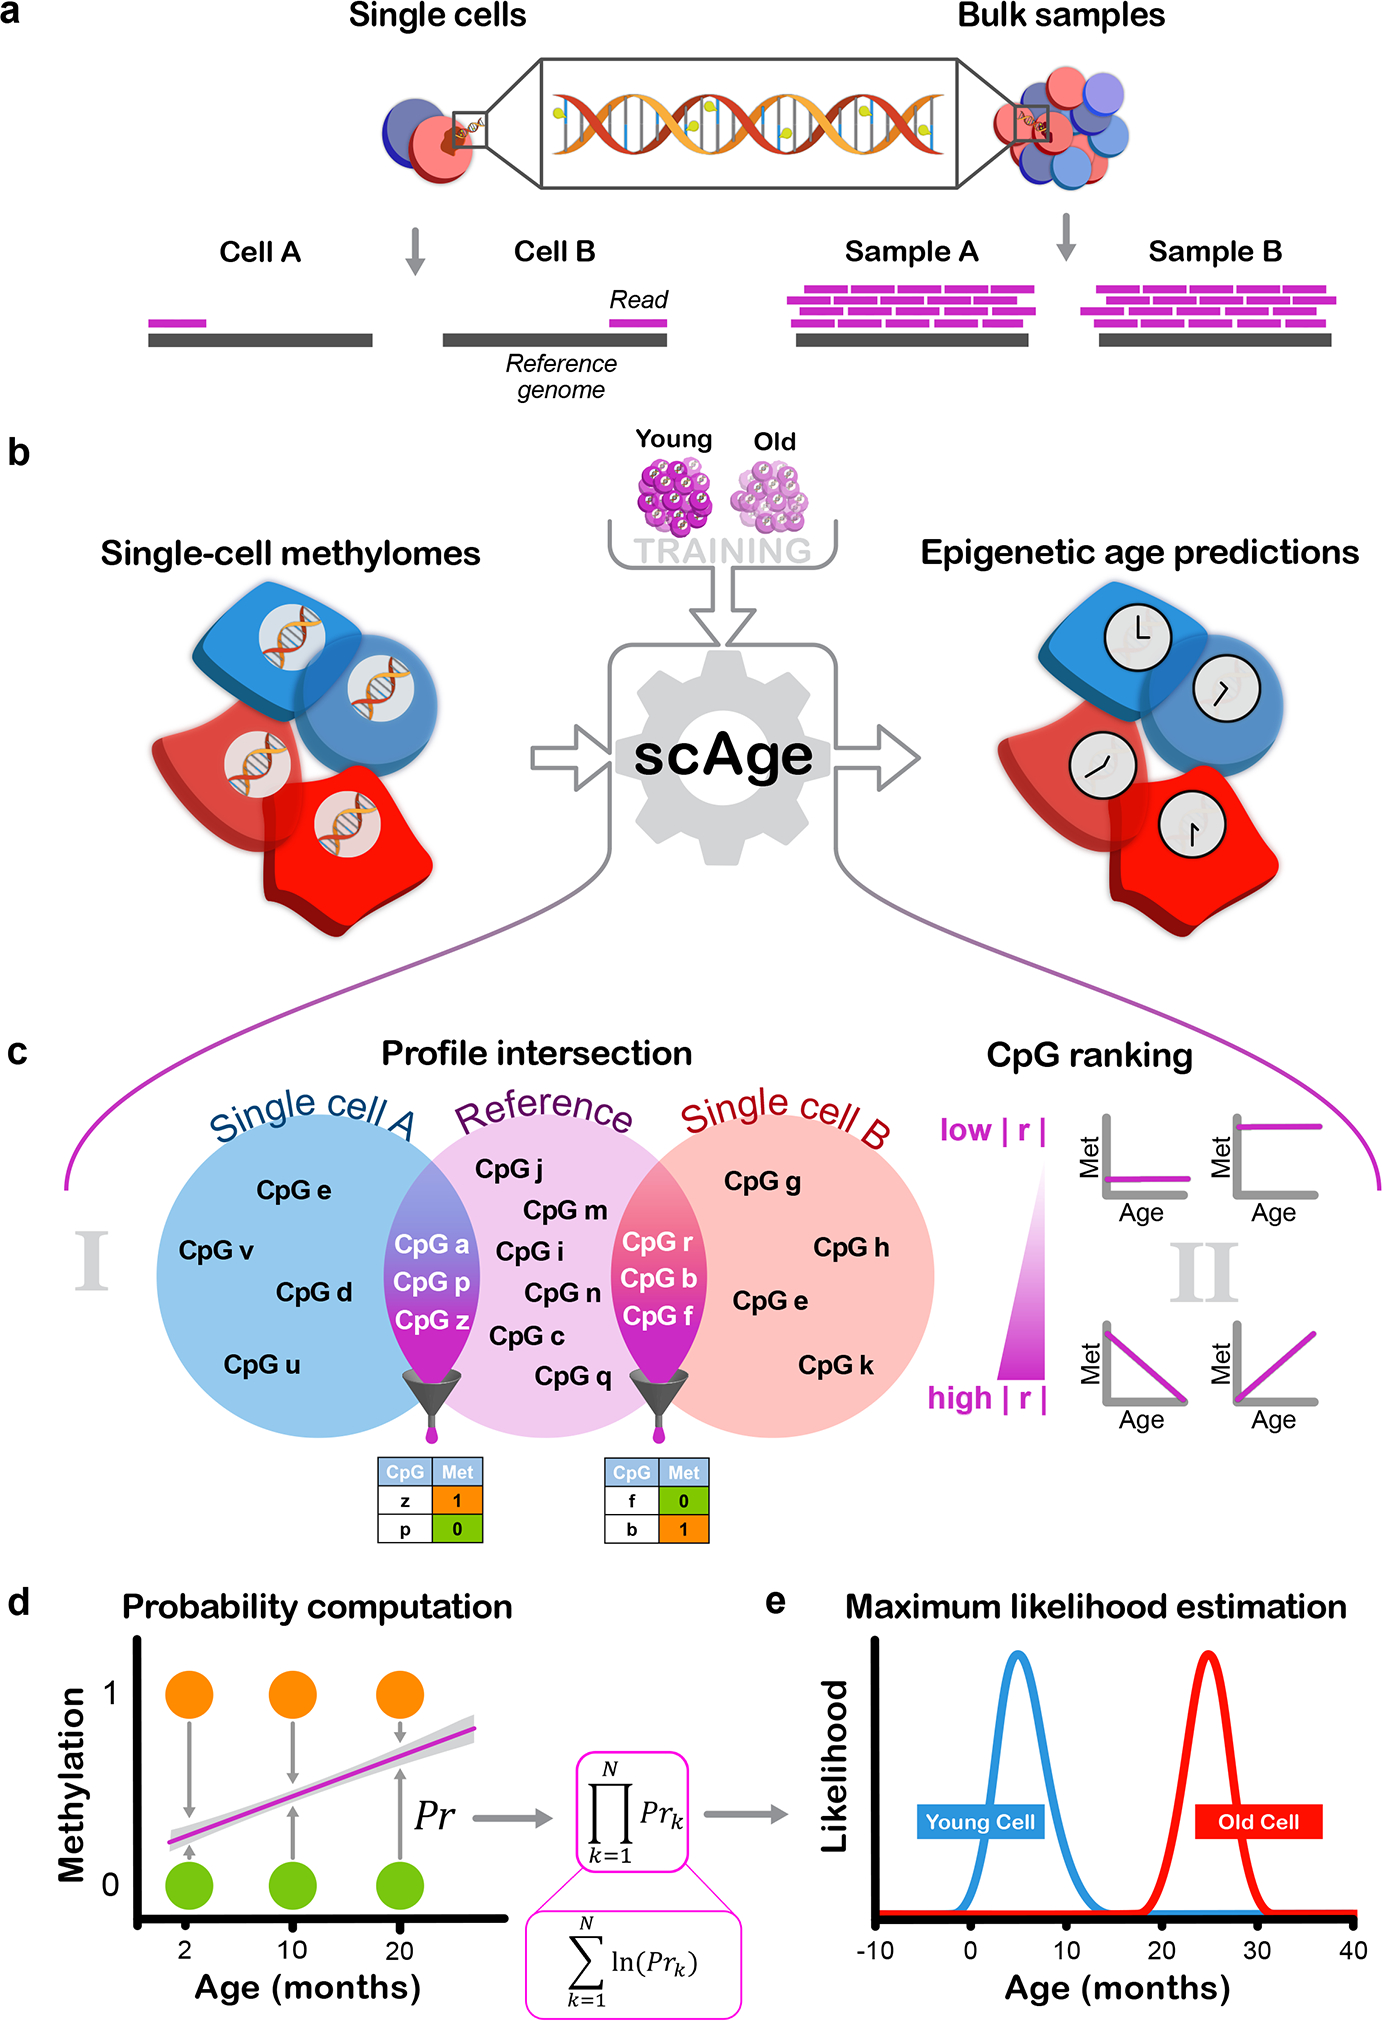
Figure 1: Designing the scAge framework.

a) Schematic representation of the distinction between single-cell and bulk methylation sequencing outputs. With bulk approaches (right), read coverage is high and consistent between samples. In single cells (left), read coverage is low (often 1) and inconsistent between single cells, resulting in limited, distinct methylome profiles.
b) Schematic representation of the scAge framework. The input (left) consists of binary single-cell methylome profiles, coupled with a training reference dataset constructed from bulk samples across a wide age range (top). In turn, the algorithm outputs epigenetic age predictions for each single cell (right).
c) Schematic of the intersection and ranking components of the framework. In (i), binary single-cell profiles are intersected with a bulk reference, and only CpGs that are common between a particular single-cell and the reference data are retained. In (ii), a ranking step is implemented that orders and selects CpGs based on their absolute Pearson correlation |r| with age. Common CpGs are filtered depending on the chosen parameter, producing binary matrices of age-associated CpG sites for each single cell (bottom).
d) Schematic of the probability computation step of the framework. Linear regression equations relating methylation and age are computed based on bulk data (purple line). Using the observed methylation status of a cell (methylated, orange; unmethylated, green), the probability of observing a particular state is computed as 1 minus the distance between the binary methylation status and the regression line estimate for a particular age.
e) Schematic of the maximum likelihood estimation step of the framework. In theory, the product of individual CpG probabilities (left) is taken (assuming independence between CpGs), generating a single probability value for each age. Practically, these fractional products are replaced by logarithmic sums to circumvent underflow errors in computation. An age-likelihood distribution is then obtained for every cell (right), and the age of maximum likelihood is interpreted as the epigenetic age of the cell (young cell in blue, old cell in red).
