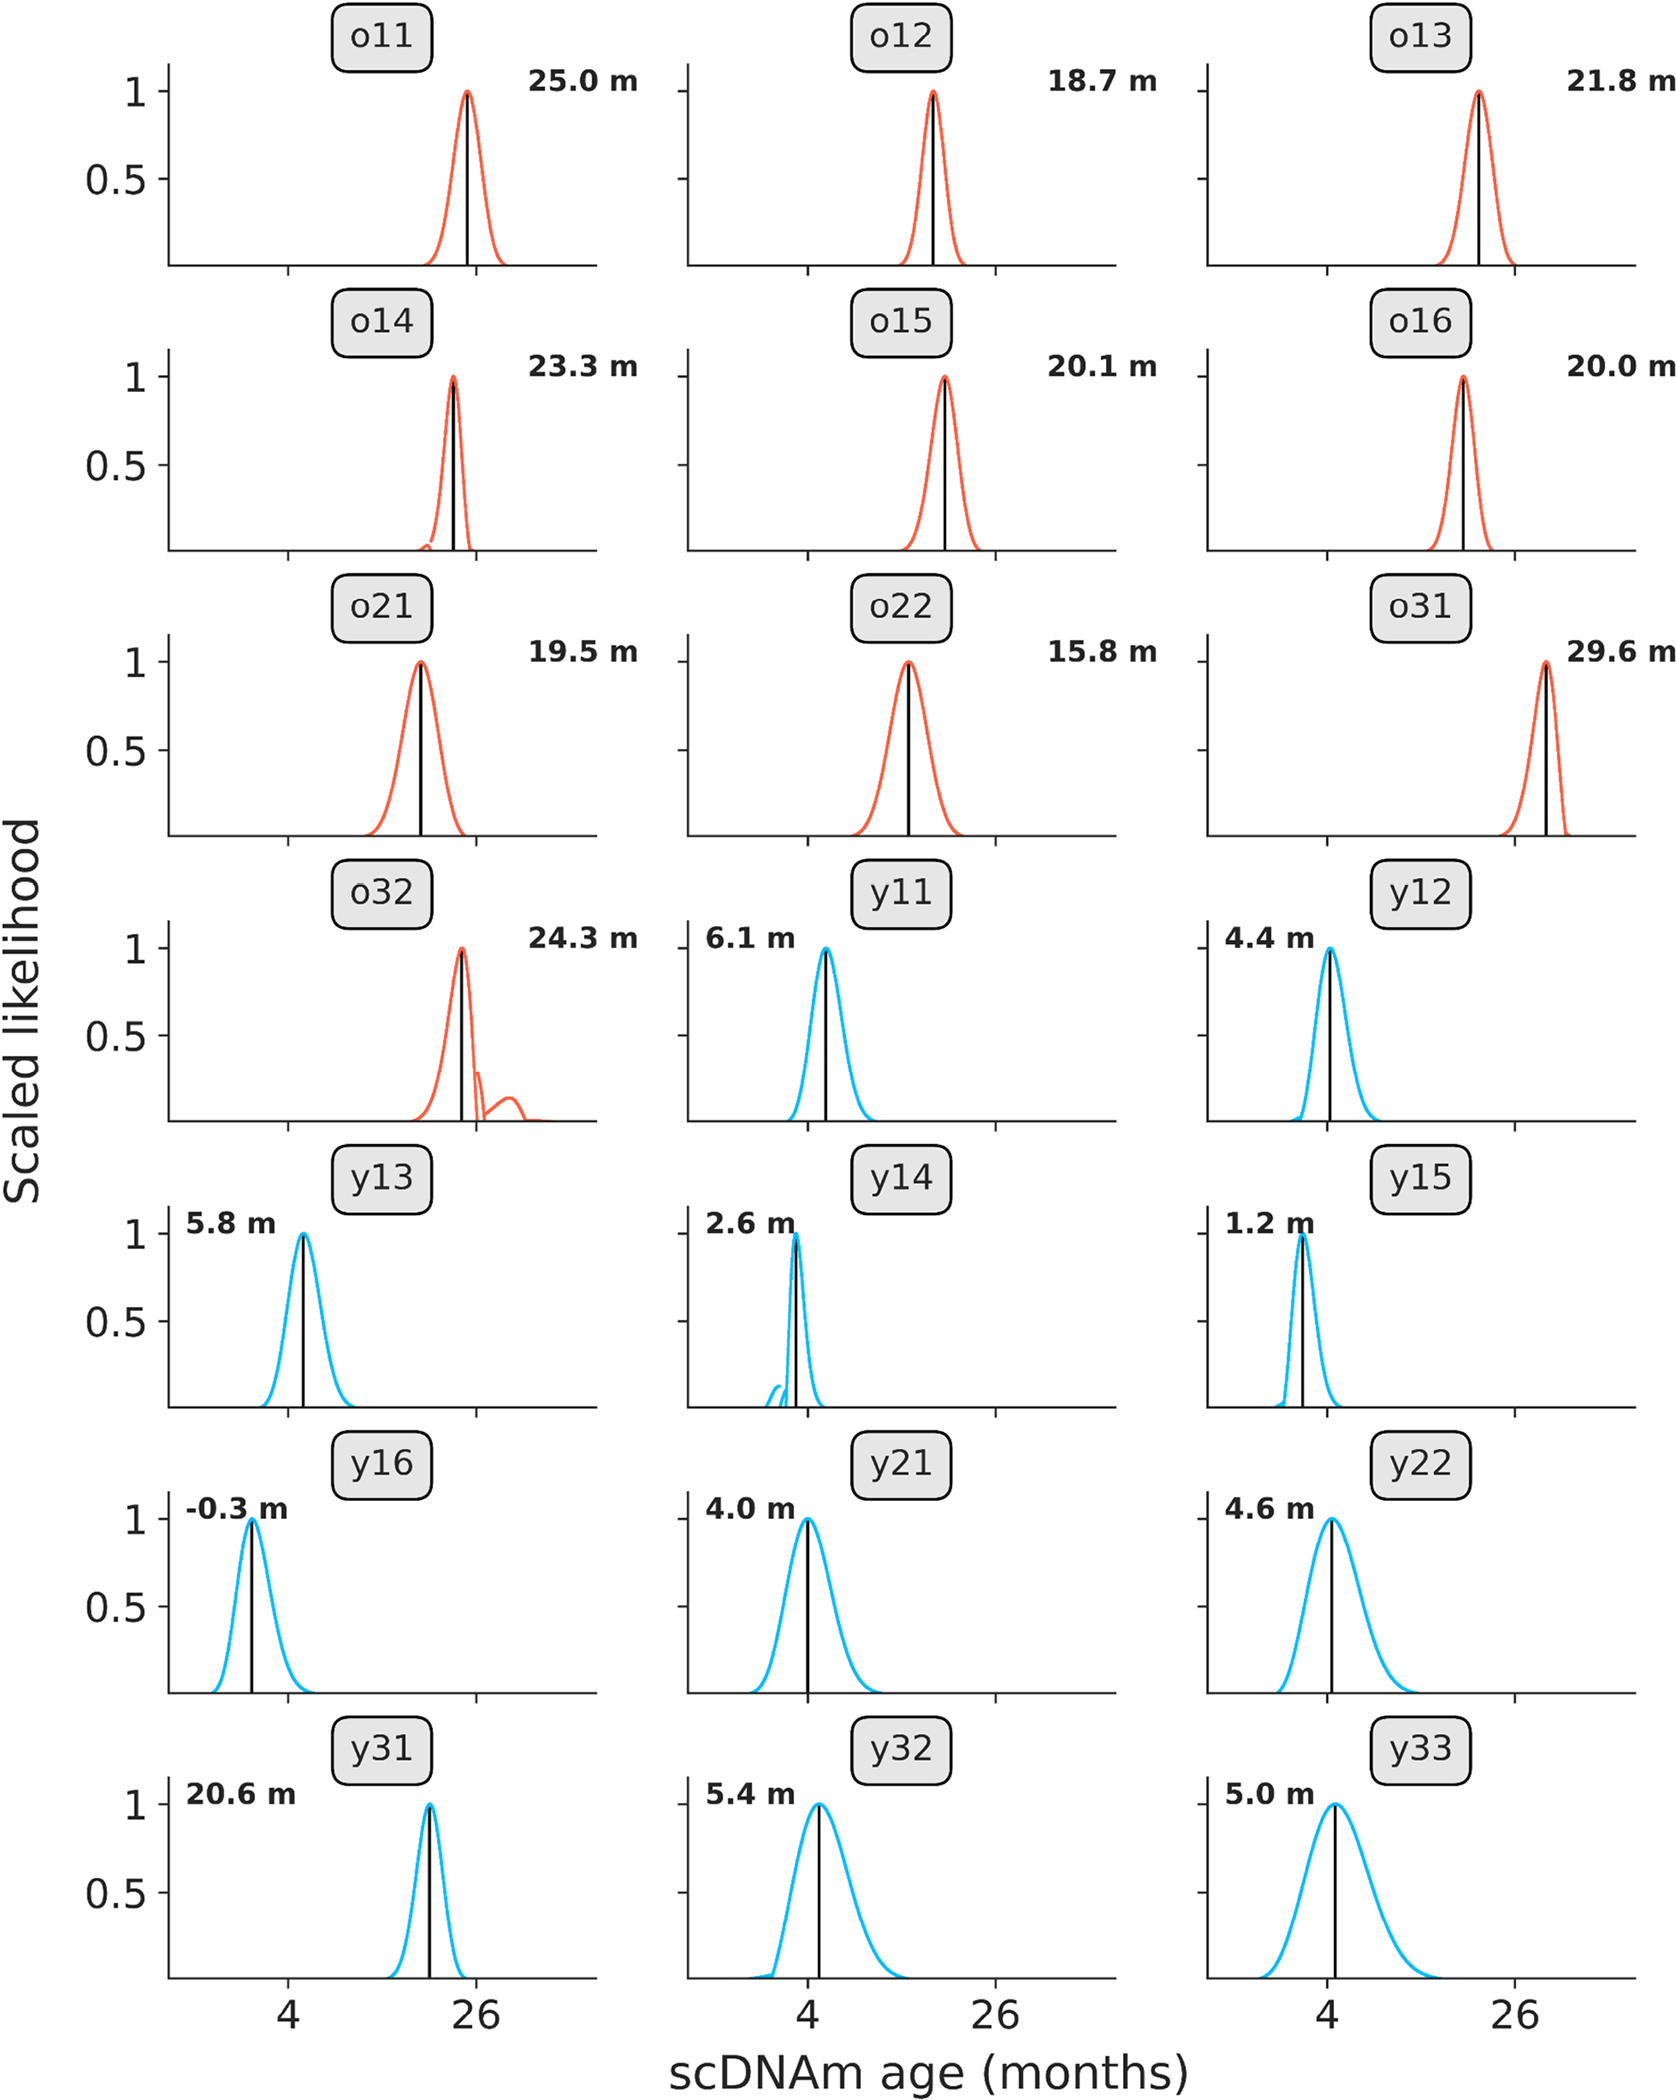
Extended Data Figure 4: Likelihood distributions in young and old hepatocytes.

Likelihood distributions for all young (blue, n = 11) and old (red, n = 10) hepatocytes, based on scDNAm results from the liver model sampling the top 1% age-associated CpGs per cell. Black lines indicate age of maximum likelihood (predicted epigenetic age), which is depicted numerically in the right or left corners of each panel. Labels indicate cell identifier, as given in the study metadata on the SRA. Likelihood was calculated by taking the exponential of the log-likelihood profiles, which was subsequently scaled between 0 and 1 to normalize distributions between cells.
