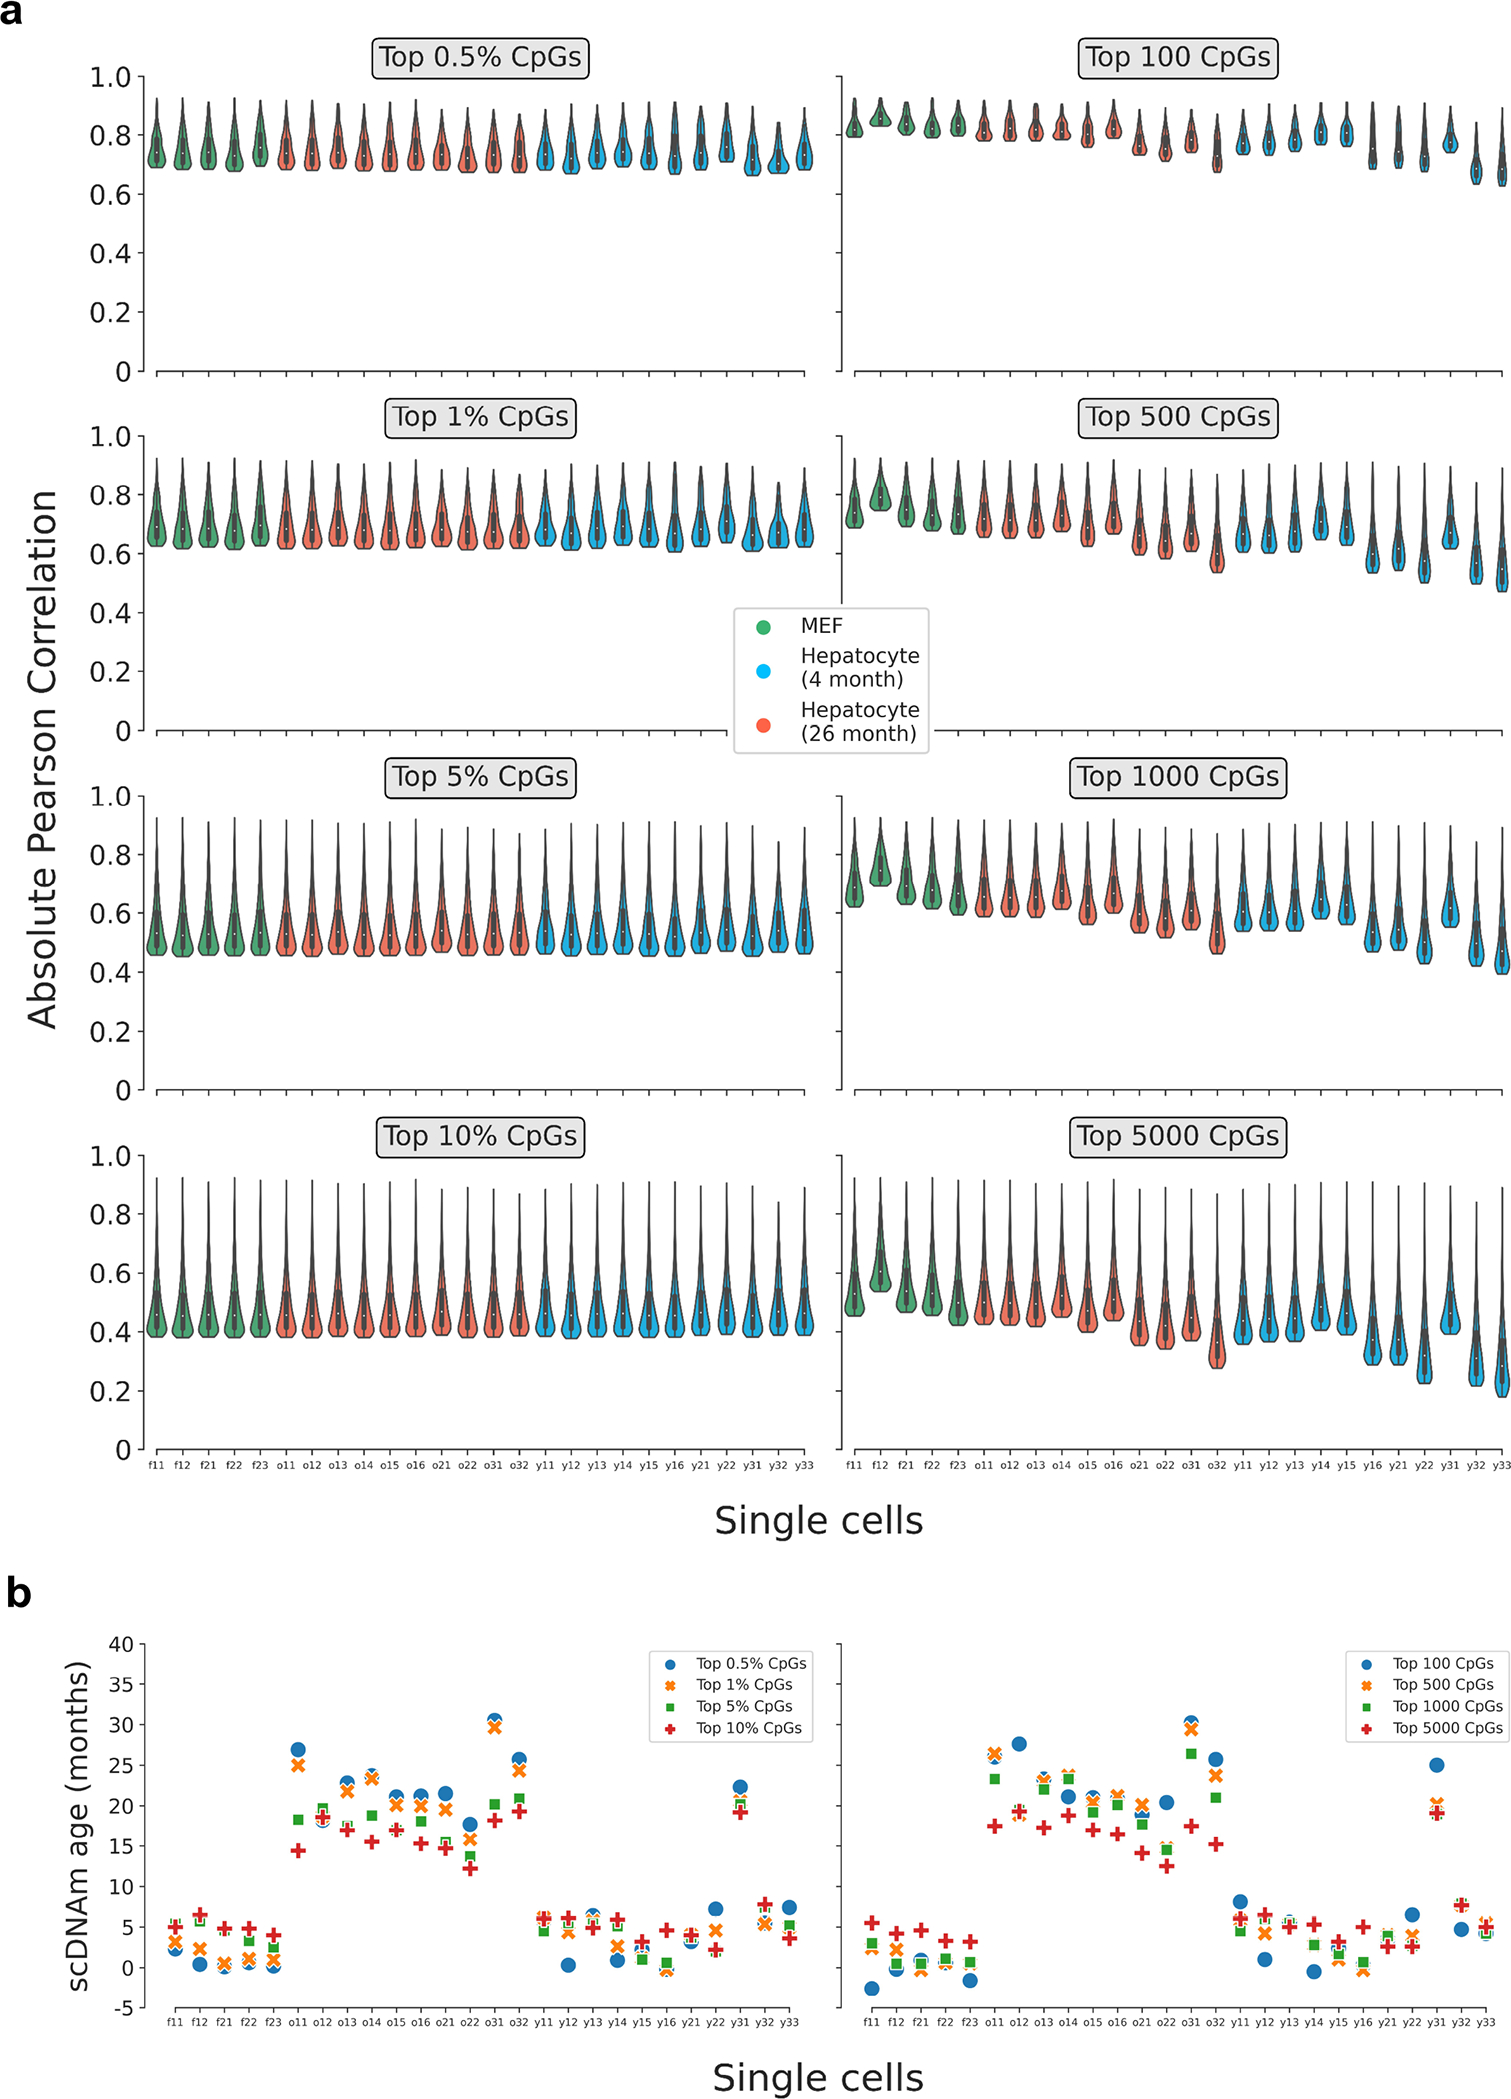
Extended Data Figure 6: Pearson correlation distributions and predicted ages in single cells based on various CpG selection parameters.

a) Violin plots depicting the distribution of the Pearson correlation coefficient of scAge-chosen CpGs in embryonic fibroblasts (n = 5, green) and hepatocytes (young, n = 11, blue; old, n = 10, red) based on the selection method. On the left, a percentile-based method is employed, whereby the top x% absolute age-associated CpGs are chosen in every cell. On the right, a defined number of CpGs is chosen across every cell, leading to more uneven distributions due to differential cell CpG coverage. Various parameters for both methods (grey boxes) and their effects on the distributions are shown. Violin plots depict kernel density estimations of the data. Inner boxplots depict median levels (white dot) and first and third quartiles, with whiskers extending up to 1.5× the interquartile range. The central legend applies to all subpanels in this panel.
b) Predicted epigenetic ages using the liver model for all embryonic fibroblasts (n = 5) and hepatocytes (young, n = 11; old, n = 10), based on the selection method (left, percentile; right, defined number of CpGs) and parameter. Colors depict the % or number of CpGs chosen for scAge computations (top 0.5% or 100 CpGs, blue; top 1% or 500 CpGs, orange; top 5% or 1,000 CpGs, green; top 10% or 5,000 CpGs, red).
