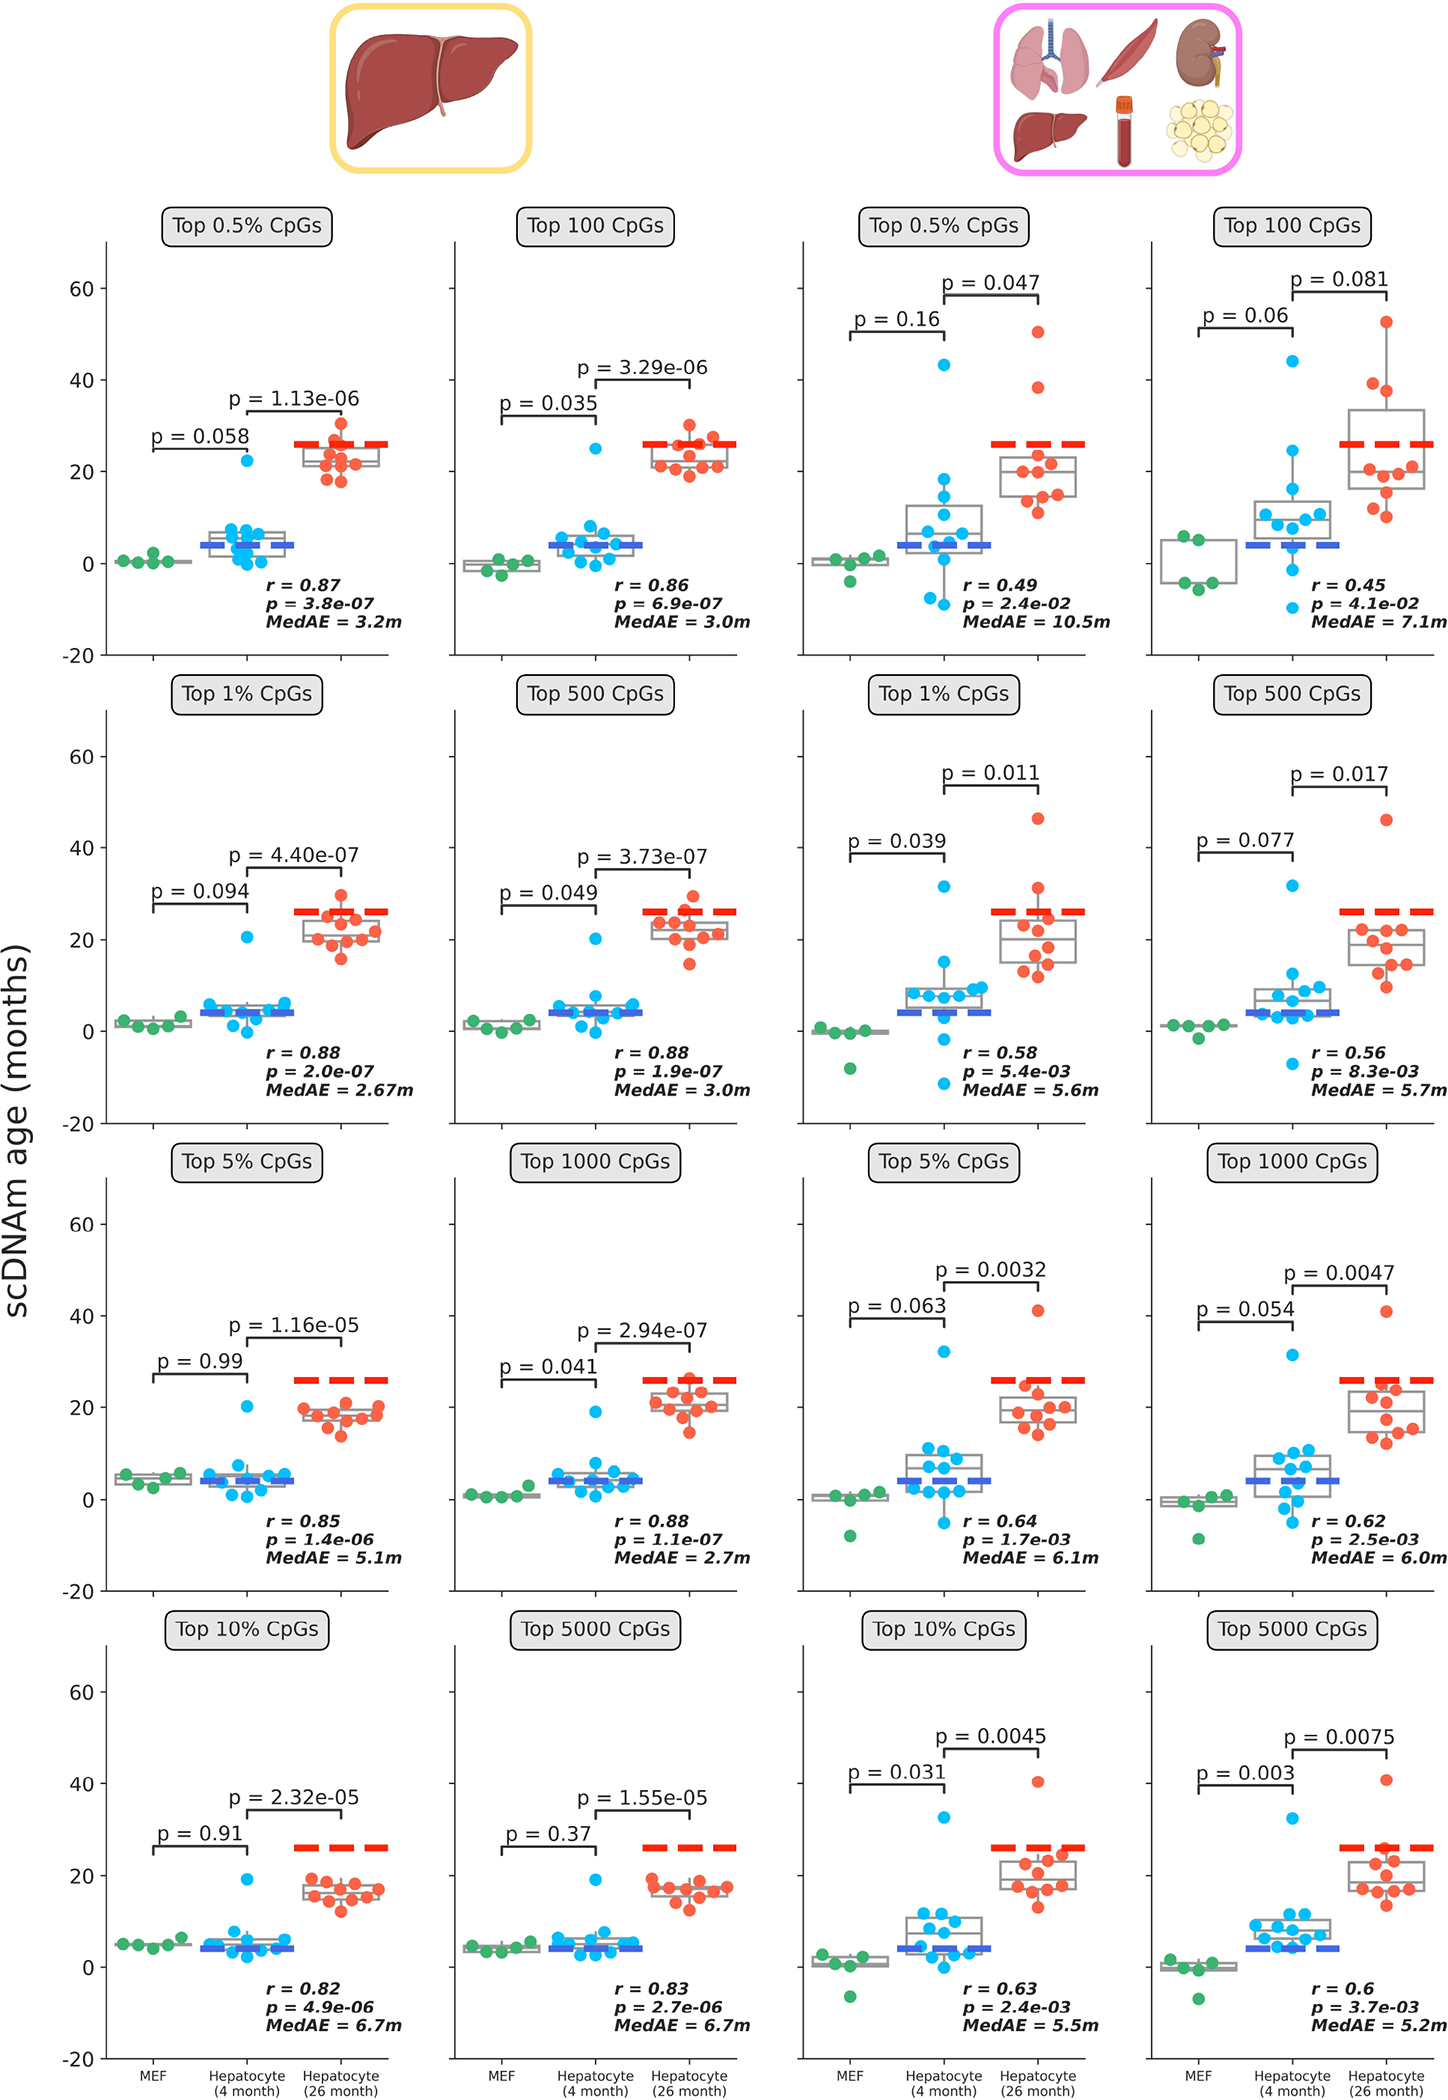
Extended Data Figure 7: Single-cell epigenetic age predictions differ based on selection mode and training dataset.

Predicted epigenetic ages in all embryonic fibroblasts (green, n = 5), young hepatocytes (blue, n = 11) and old hepatocytes (red, n = 10) using the liver model (left two columns) and multi-tissue models (right two columns) across different CpG selection modes and parameters. Parameters are labeled in grey boxes above the plots. Bonferroni corrections were applied to account for multiple testing. Pearson correlation (r), its associated p-value (p), and the median absolute error (MedAE) are shown for each panel. Two-tailed Pearson correlation analysis was employed for statistical testing. Dashed lines represent the chronological age of animals from which hepatocytes were obtained (4-months-old, dark blue; 26-months-old, dark red). Boxplots depict median levels and the first/third quartile, with whiskers extending up to 1.5× the interquartile range. Individual cells are depicted as points.
