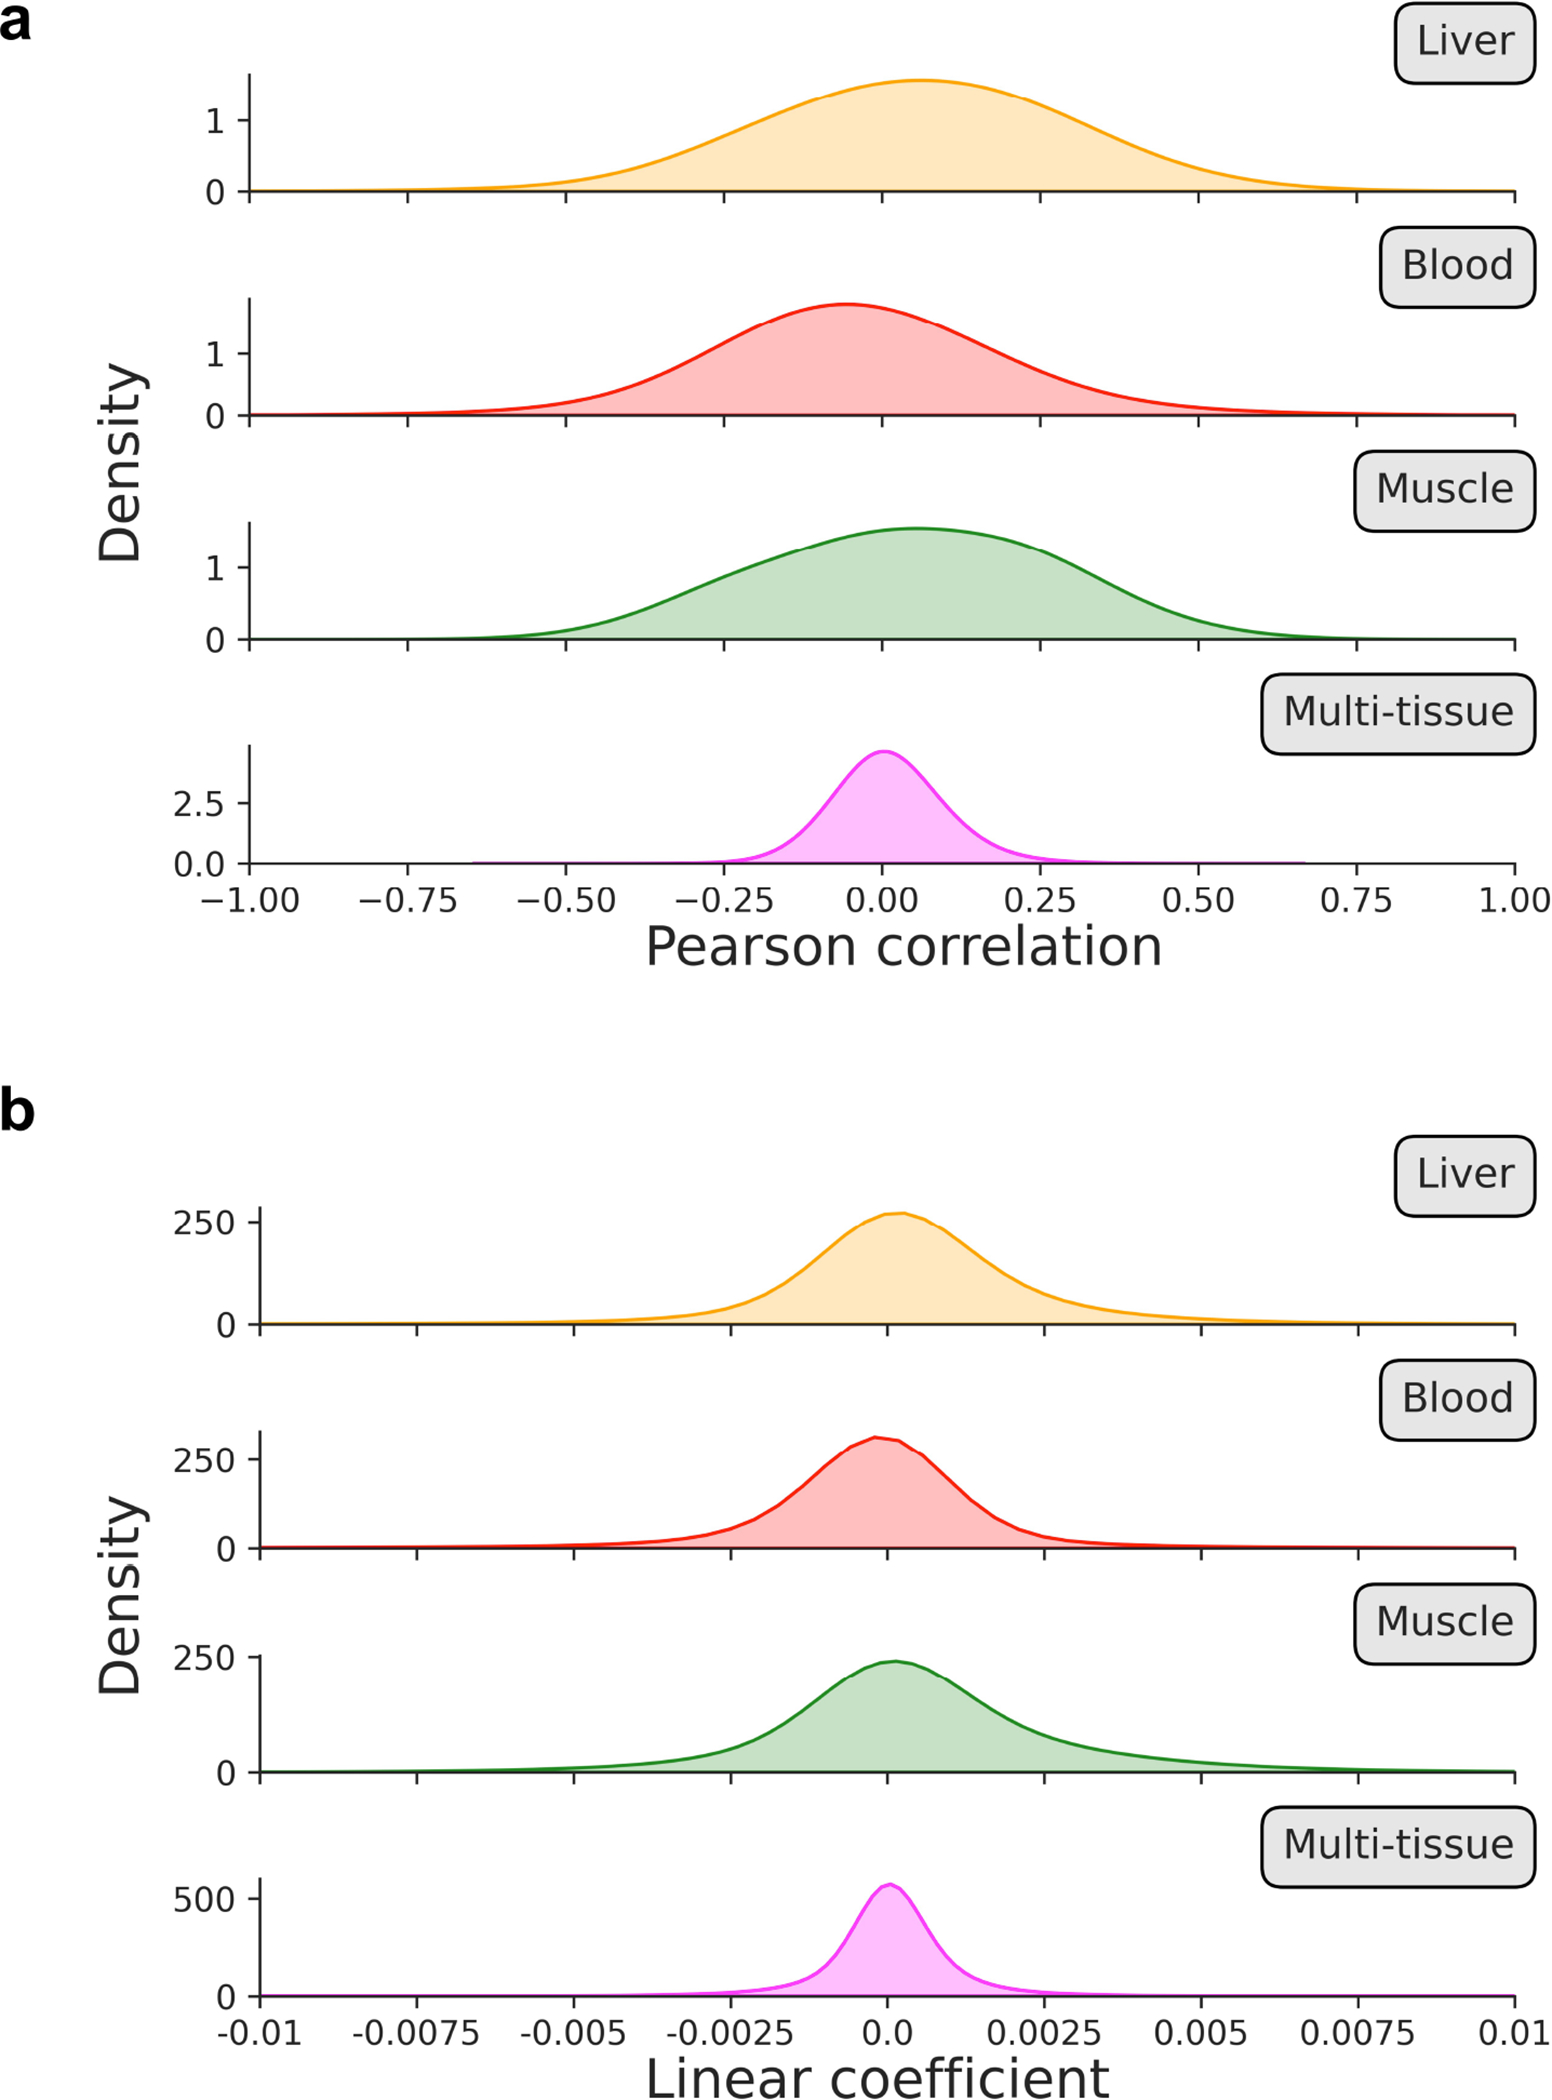
Extended Data Figure 8: Distribution of Pearson correlation coefficients and linear association metrics across training datasets.

a, b) Kernel density estimation plots for (a) Pearson correlation coefficients and (b) linear regression coefficients in processed training reference data for liver (orange), blood (red), muscle (green), and multi-tissue (magenta) datasets. Individual distributions are labeled on the upper right side to indicate which tissue is depicted.
