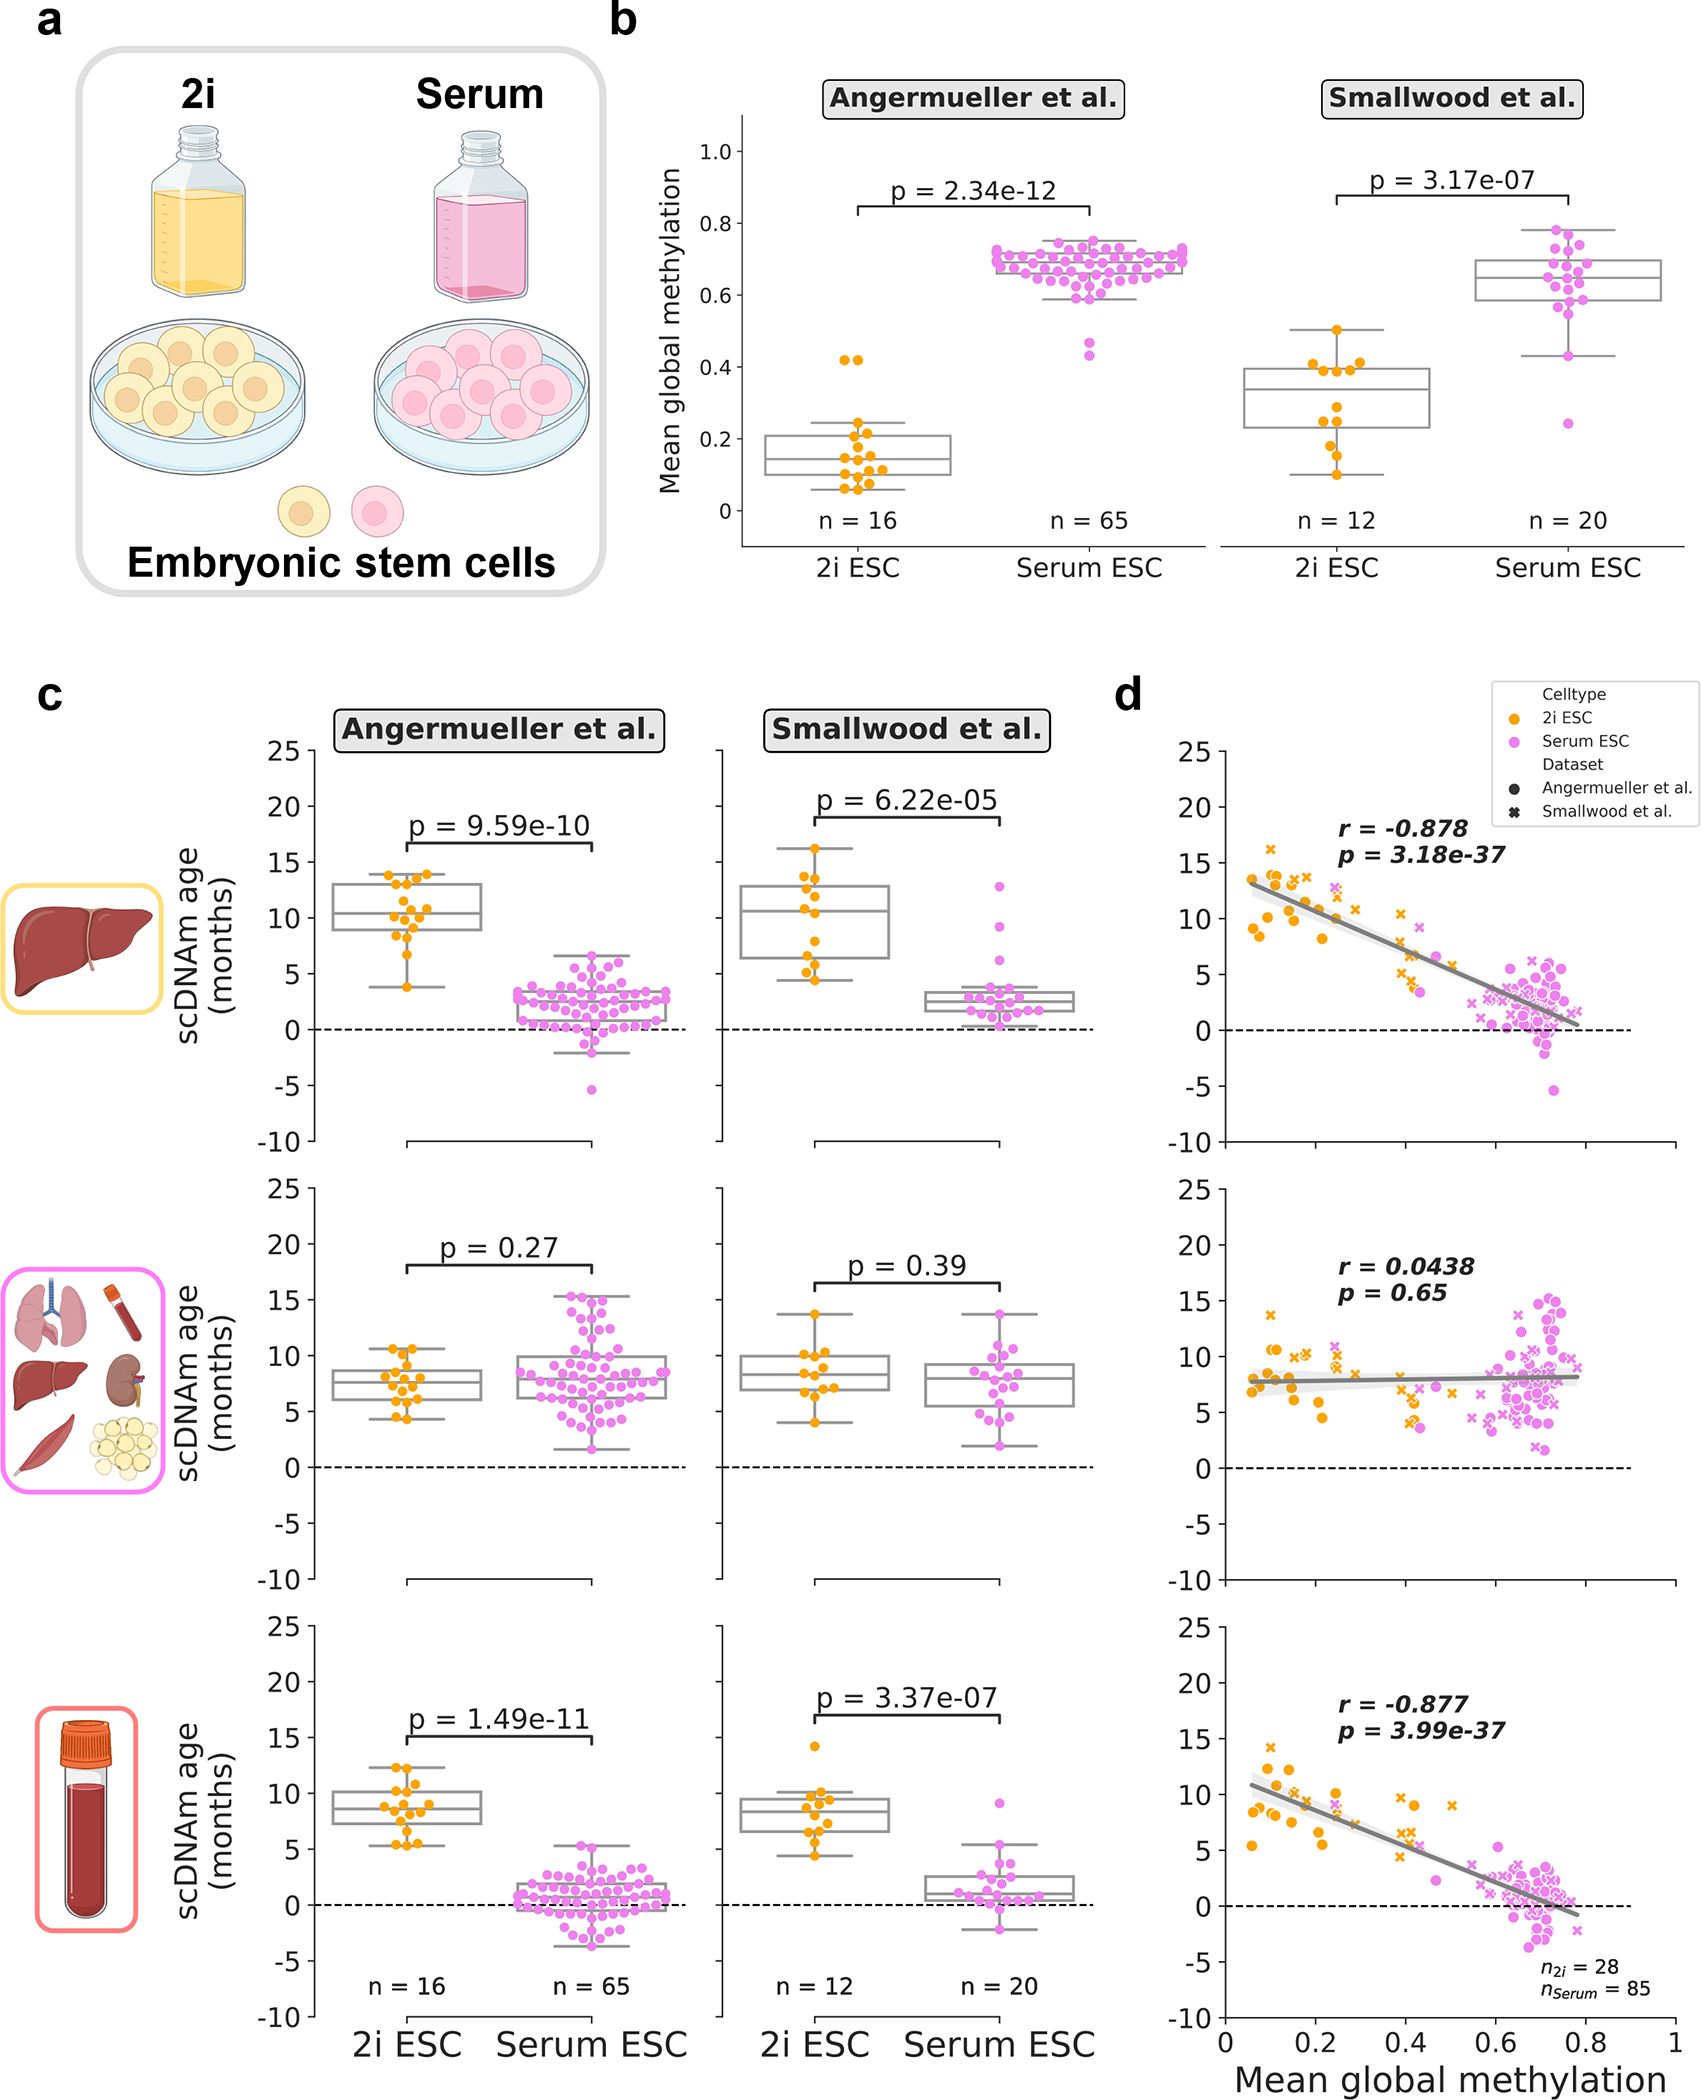
Figure 4: Culture conditions influence epigenetic age in single embryonic stem cells.

a) Schematic representation of single cells analyzed in this figure25,27. Cells were grown in media supplemented with serum, or in serum-free media with the addition of two small-molecule inhibitors (“2i”) for the MEK and GSK3β pathways.
b) Mean global methylation profiles of single embryonic stem cells grown in 2i (yellow; nAngermueller = 16, nSmallwood = 12) or serum culture conditions (purple; nAngermueller = 65, nSmallwood = 20). Two-tailed Welch’s t-test was used for statistical testing, with statistics for each dataset treated independently without correction. Box plots highlight median levels and the first and third quartile, with whiskers depicting observations up to 1.5× the interquartile range. Dots depict individual cells.
c) Predicted epigenetic ages in 2i (yellow; nAngermueller = 16, nSmallwood = 12) and serum-grown ESCs (purple; nAngermueller = 65, nSmallwood= 20) across liver (top), multi-tissue (middle), and blood (bottom) models. Two-tailed Welch’s t-test was used for statistical testing, with statistics for each model and dataset treated independently without correction. Box plots highlight median levels and the first and third quartile, with whiskers depicting observations up to 1.5× the interquartile range. Dots depict individual cells.
d) Scatterplot relationship between predicted epigenetic age and mean global methylation among all embryonic stem cells (n2i = 28, yellow; nserum = 85, purple). Regression lines (grey) are depicted with 95% confidence intervals (light grey). Pearson correlation (r), and the associated p-value (p) are shown. Two-tailed Pearson correlation analysis was used for statistical testing, with statistics for each model and dataset treated independently without correction. Box plots show median levels and the first and third quartile, and whiskers show 1.5× the interquartile range. Dots depict individual cells, with the symbol denoting study of origin.
