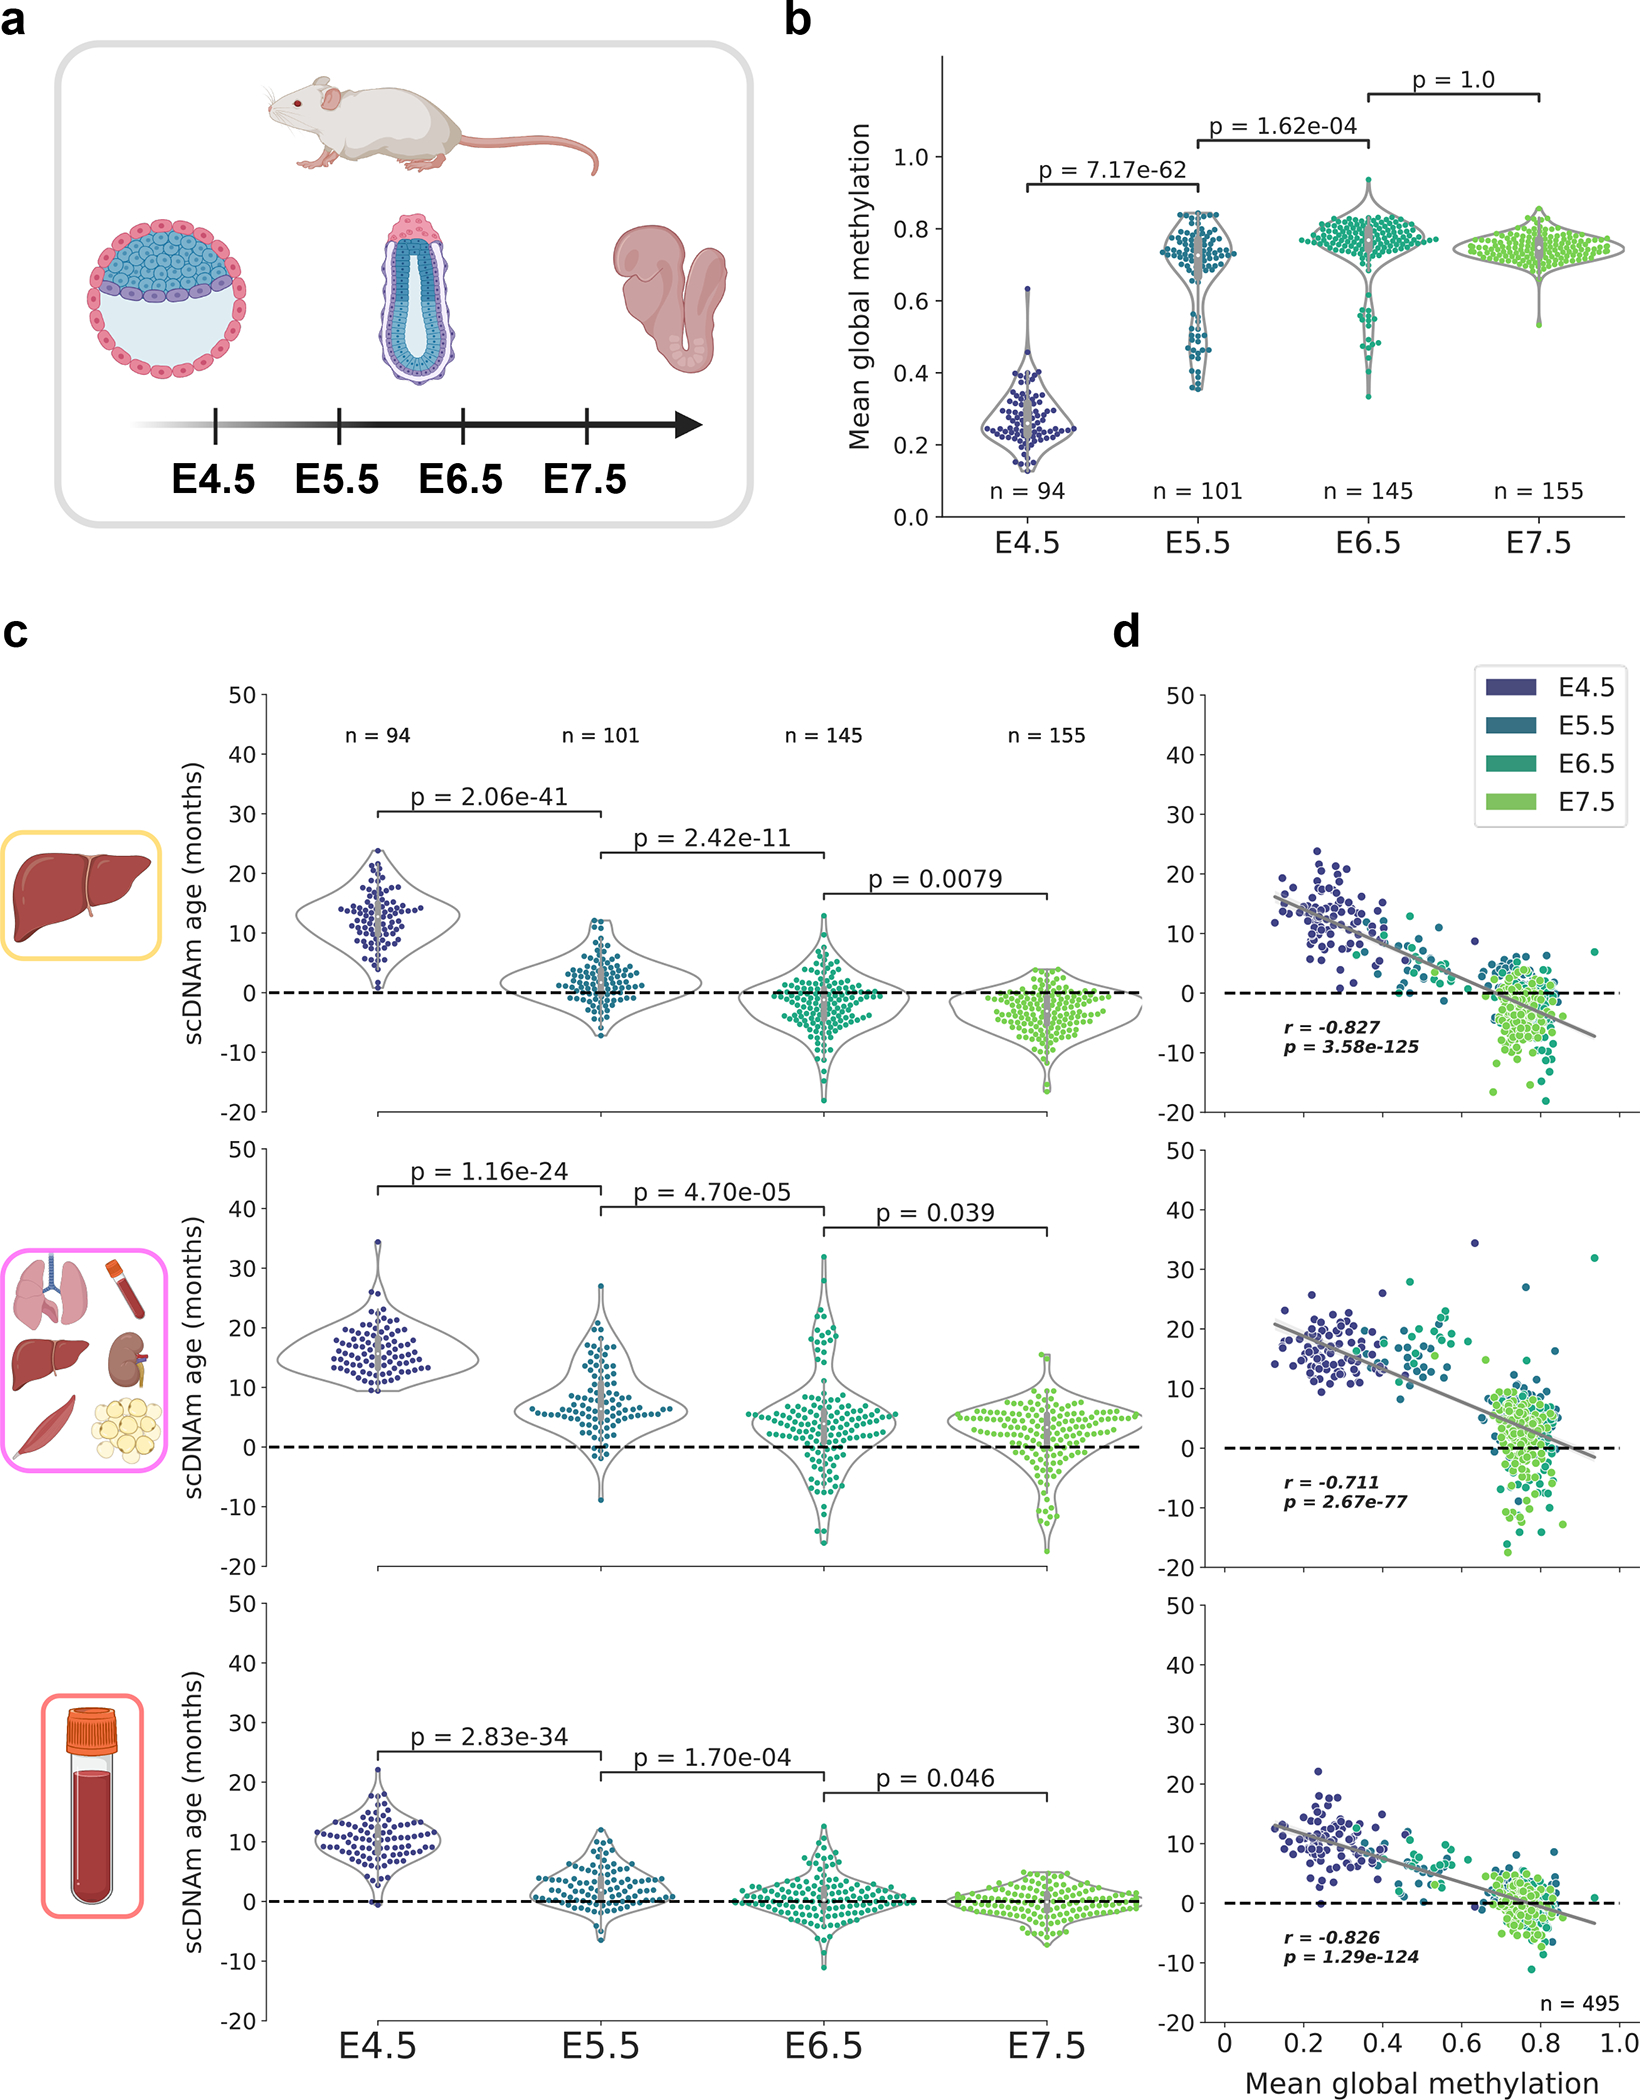
Figure 5: An epigenetic rejuvenation event during mouse embryogenesis.

a) Schematic representation of cells analyzed in this figure28. Single cells from mouse embryos at four developmental stages (E4.5, E5.5, E6.5, and E7.5) were isolated and sequenced. Only cells with at least 500,000 CpGs covered were retained for downstream analysis (see Extended Data Fig. 9a for additional details).
b) Mean global methylation profiles in single cells across all four developmental stages assayed (nE4.5 = 94, purple; nE5.5 = 101, dark blue; nE6.5 = 145, dark green; nE7.5 = 155, light green). Two-tailed Welch’s t-test was used for statistical testing, and Bonferroni corrections were applied to correct for multiple testing. Violin plots depict the kernel density estimations of the data, and inner boxplots (grey) depict median levels and the first and third quartile, with whiskers extending up to 1.5× the interquartile range. Dots depict individual cells.
c) Predicted epigenetic ages for cells in all four developmental stages (nE4.5 = 94; nE5.5 = 101, nE6.5 = 145; nE7.5 = 155), across the liver (top), multi-tissue (middle), and blood (bottom) scAge models. Colors correspond to those detailed in (b). Two-tailed Welch’s t-test was used for statistical testing, with Bonferroni corrections applied to correct for multiple testing. Violin plots depict the kernel density estimate of the data, and inner boxplots (grey) depict median levels and the first and third quartile, with whiskers extending up to 1.5× the interquartile range. Dots depict individual cells.
d) Scatterplot depicting the relationship between mean global methylation and predicted epigenetic age across all cells (n = 495) in liver (top), multi-tissue (middle), and blood (bottom) models. Colors correspond to those in (b) and in the legend in the top right. Regression lines (grey) are depicted with 95% confidence intervals (light grey). Pearson correlation (r), and the associated p-value (p) are shown. Two-tailed Pearson correlation analysis was used for statistical testing, with statistics for each dataset treated independently without correction.
