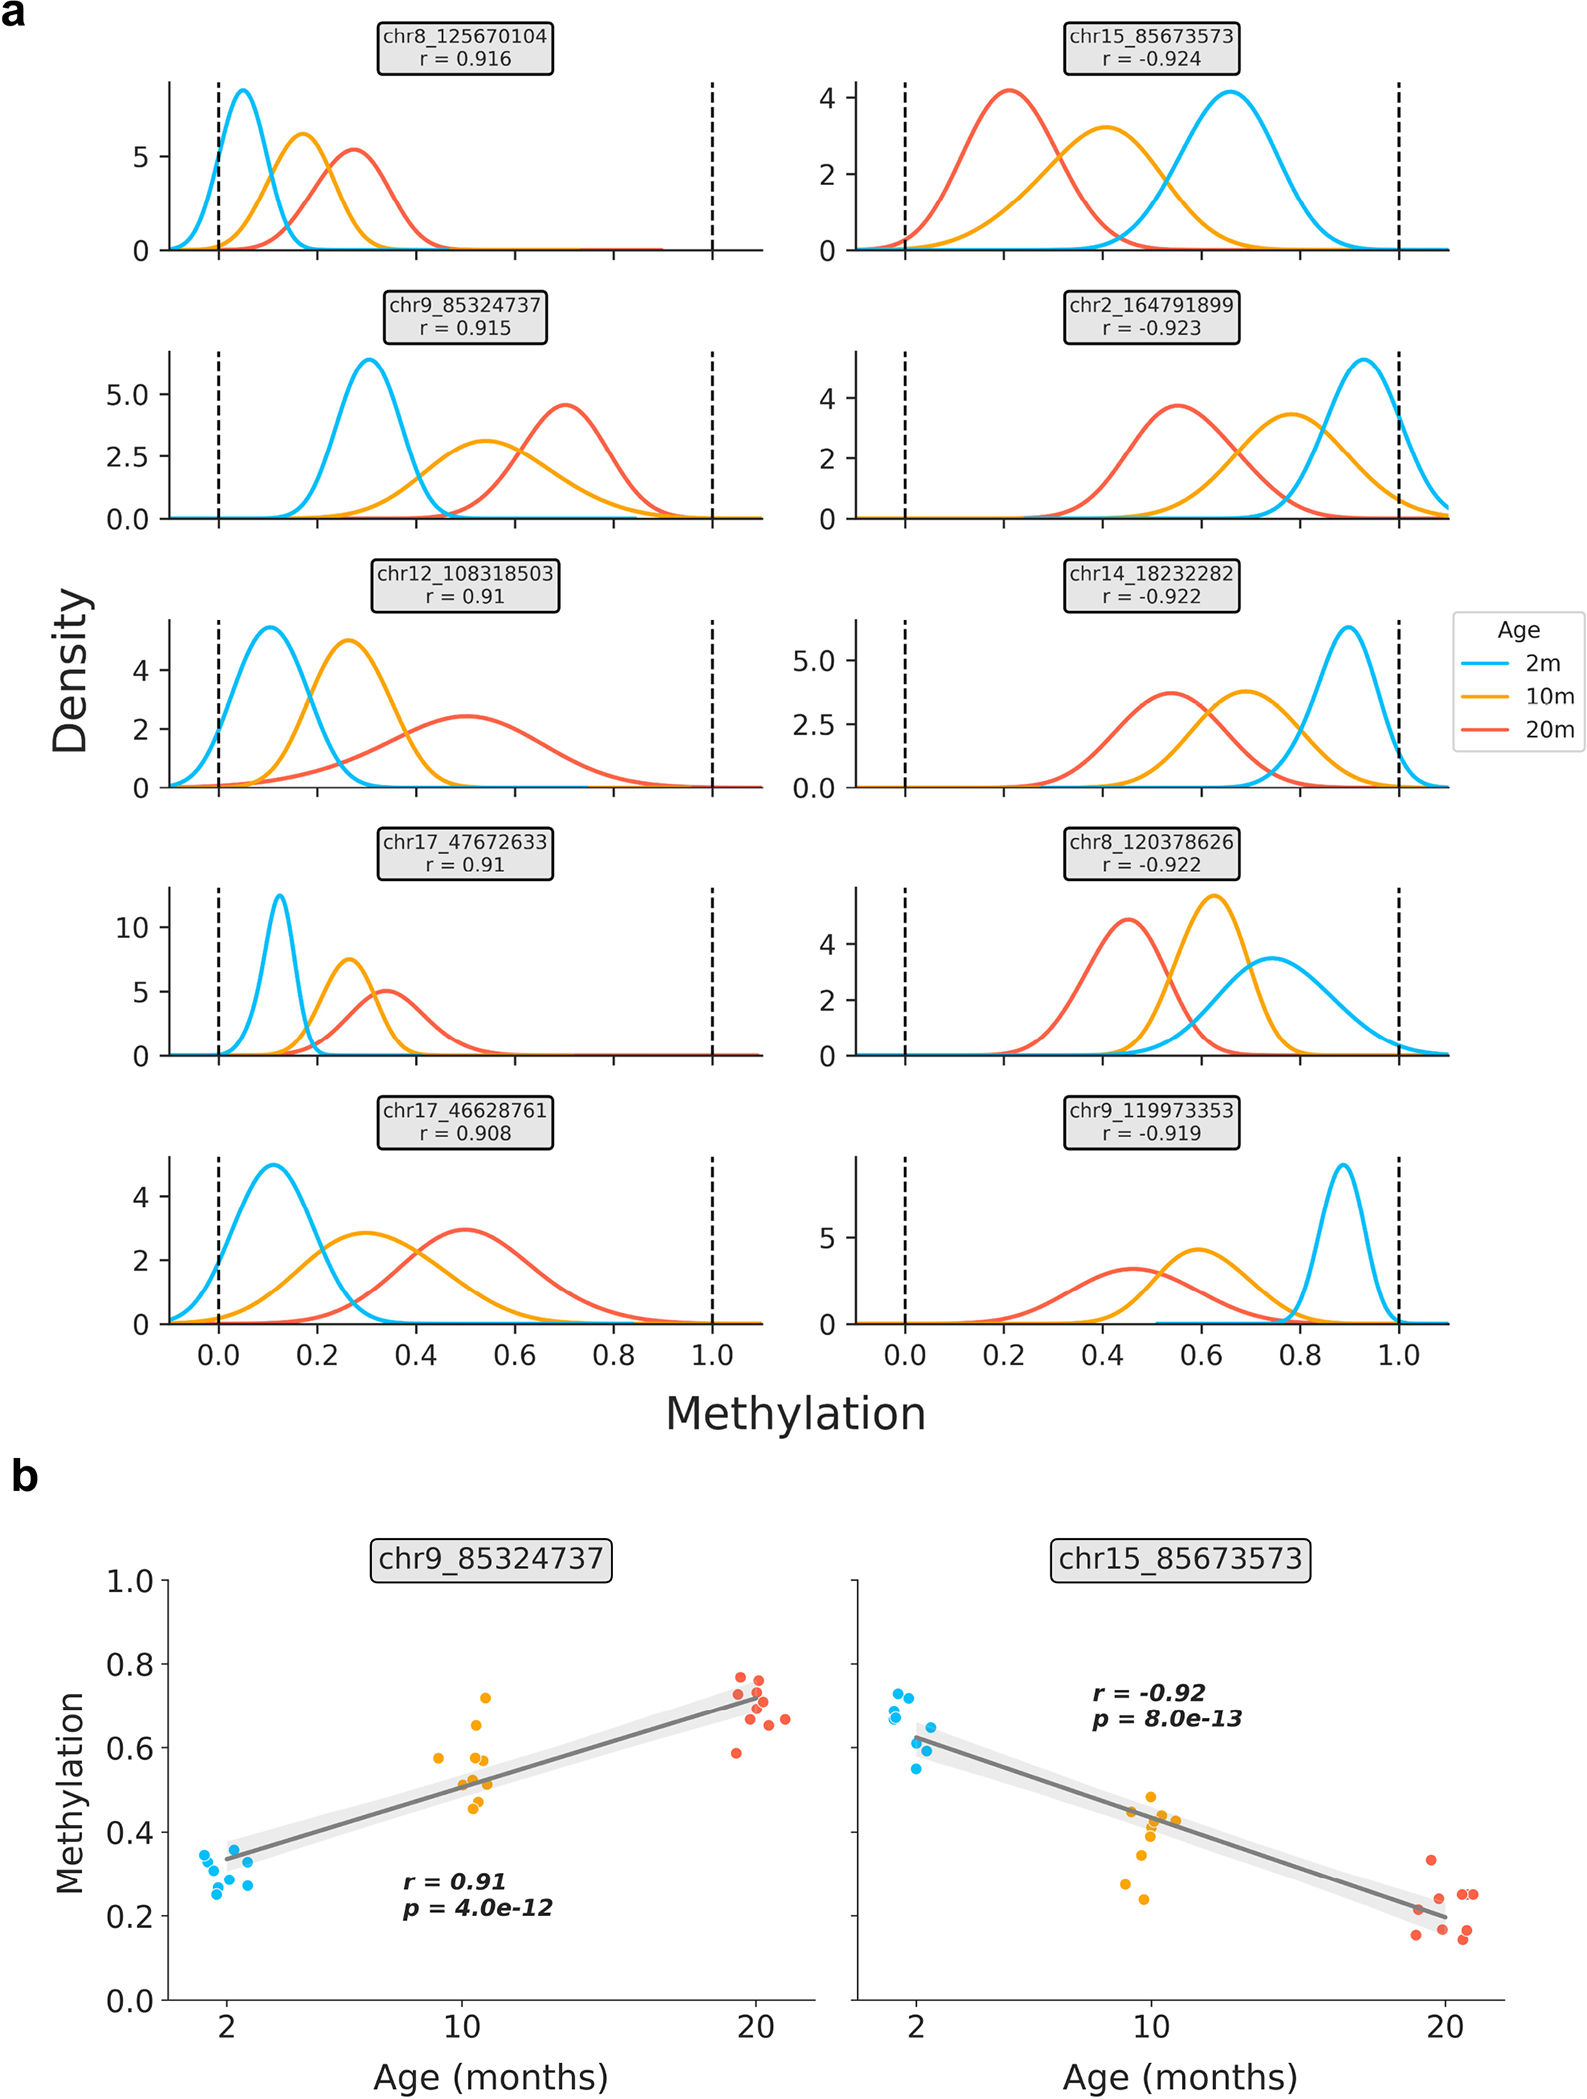
Extended Data Figure 2: Relationship between age and bulk methylation level in age-associated CpG sites in liver.

a) Kernel density estimation plots for the top 5 positively and negatively age-correlated CpG sites in the bulk liver data (based on n = 29 samples). CpG genomic positions are shown above each panel, along with the Pearson correlation coefficient (r) between methylation level and age. Colors correspond to the ages of mice (2m, blue; 10m, orange; 20m, red).
b) Representative scatterplots showing the relationship between age and methylation level in strongly positively (left) and negatively (right) age-associated CpG sites. Jitter was applied to the x-axis (age) purely for visualization purposes. Regression lines (grey) with 95% confidence intervals (light grey) are shown. Pearson correlation coefficients (r) and associated p-values (p) are shown. Two-tailed Pearson correlation analysis was employed for statistical testing, with statistics for each model treated independently without correction. Colors correspond to the ages of mice (2m, blue; 10m, orange; 20m, red).
