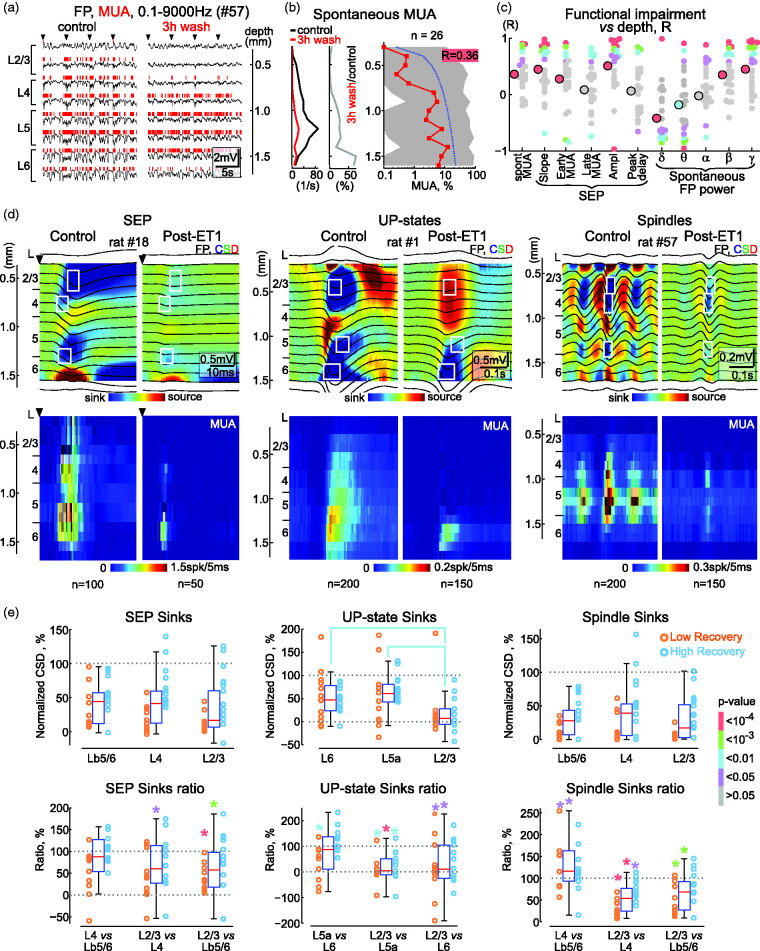
Figure 2.
Vertical gradient of functional impairments in the ischemic focus. (a) Example of recordings of spontaneous activity in different cortical layers (FP, black traces and MUA, red vertical bars above) under control conditions (left) and at the end of the 3rd hour of ET1 washout (right) in rat #57. Arrowheads indicate principal whisker deflections. (b) Corresponding MUA frequency across cortical depth in control conditions and in the ischemic focus (left, absolute values and middle, normalized to control) in rat #57. Right, depth profile of MUA frequency in the ischemic focus normalized to control values (n = 26). Red squares show median, shadedContinued.area shows Q1–Q3 intervals, blue dotted line shows linear approximation, R box shows correlation coefficient, and its background codes for p-value according to the p-value bar at the right of panel E. (c) Correlation analysis between suppression level and cortical depth for various parameters of spontaneous and sensory-evoked FP and MUA. Each small circle indicates the R-values of an individual animal, large circles indicate the R-values of the population. The color of the circle indicates the p-value according to the p-value bar at the right of panel E. Pooled data from 26 rats. (d) Average SEP, delta (UP-states) and spindle oscillations (FP, top panels and MUA, bottom panels) in control and at the end of the 3rd hour of ET1 washout across the cortical depth, overlaid on the color-coded CSD and MUA density maps, respectively. White rectangles indicate the regions for calculation of the main sinks. (e) Levels of suppression of the main sinks following ET1 treatment relative to control values for SEPs, UP-states of delta oscillations and spindle troughs (top panels) and the corresponding relative changes of the main sinks in the post-ET1 cortex (bottom panels). Each circle indicates values from an individual animal, circle color indicates high and low recovery of MUA*. Note that sinks in the superficial layers of post-ET1 cortex are more severely suppressed than deep sinks. Colored brackets and * indicate significant differences and their color indicates the p-value according to the p-value bar on the right. Pooled data from 26 rats. Lb5/6 denotes border between L5 and L6.

