Figure 6.
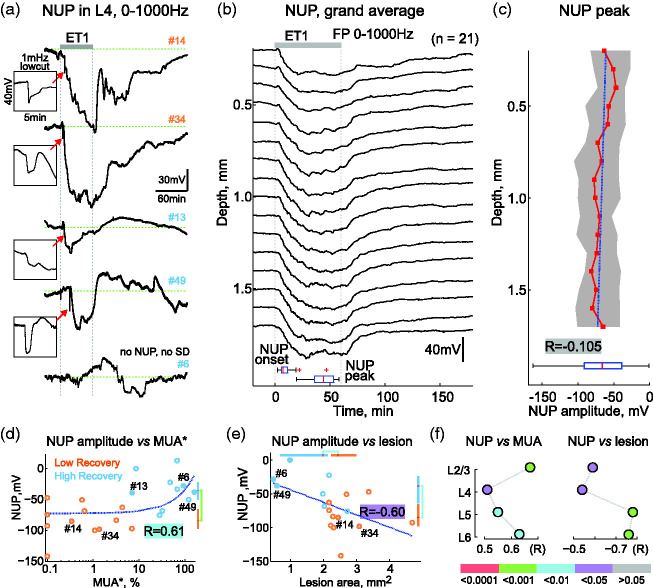
Negative ultraslow potentials and ischemic injury. (a) Examples of NUP (0-1000Hz) recorded from L4 during 1 hour of ET1 application and 3 hours of ET1 washout in two low recovery (orange #) and three high recovery (blue #) cases. Insets in the boxes show SDs at NUP onset on an expanded time scale. (b) Grand average depth profile of NUPs. Bottom, statistics on the onset and peak times of NUPs. (c) Depth profile of the NUP amplitude peak. Layout as in Figure 2(b). Bottom, distribution of NUP amplitude averaged over the entire cortical depth. (d and e) Correlation between NUP amplitude and MUA* in the ischemic focus (d) and ischemic lesion size (e). Layout as in Figure 3(c). (f) Correlation of NUP amplitude with MUA in the ischemic focus (left) and with ischemic lesion length (right) in different cortical layers. p-values are color-coded according to the bar below.

