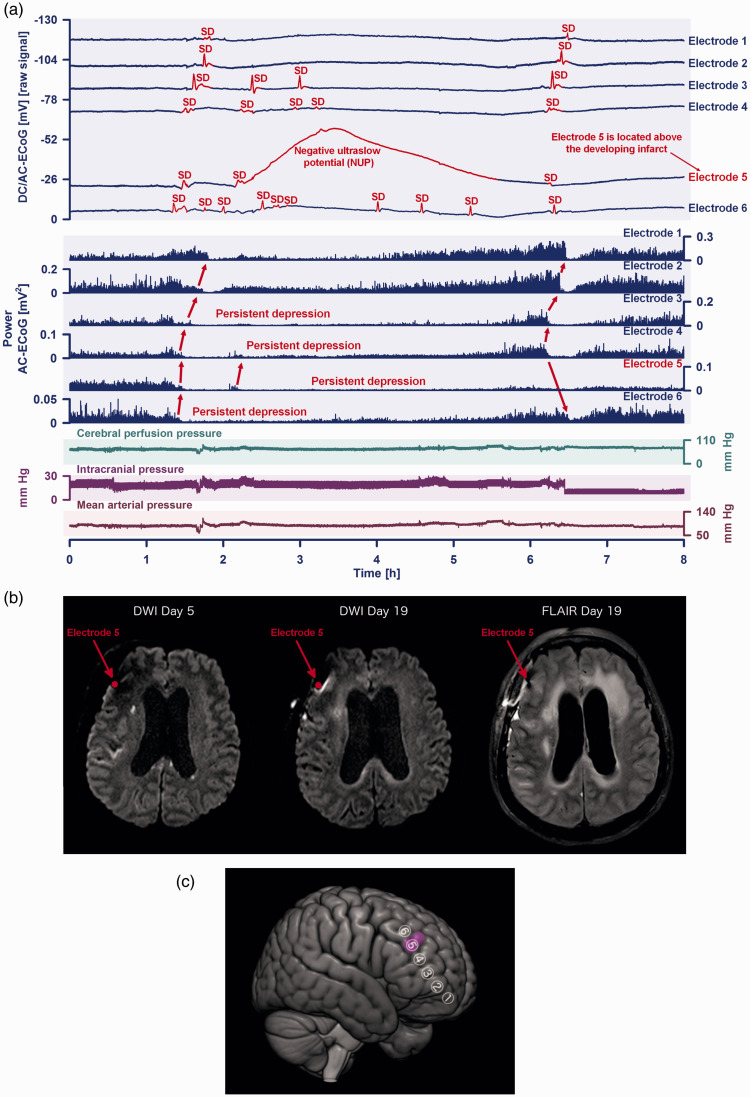
Figure 7.
(a) This 64-year-old woman with aneurysmal subarachnoid hemorrhage (aSAH) showed a cluster of ten spreading depolarizations (SDs) that occurred during six hours on the seventh day after the initial hemorrhage. The patient was enrolled at Charité – Universitätsmedizin Berlin in the prospective, observational, multicenter, cohort, diagnostic phase III trial ‘DISCHARGE-1’. 6 Traces 1 to 6 from top to bottom give the direct current (DC)/alternating current (AC)-electrocorticography (ECoG) recordings (bandpass: 0–45 Hz) at electrodes 1–6. SDs are observed as a negative DC shift (marked in red, negative voltage changes are shown as upward deflections following the EEG polarity convention). SDs propagated across the cortex from electrode 6 to 1. Selectively at electrode 5, the second SD resulted in a negative ultraslow potential (NUP) of high amplitude (−37.9 mV) lasting for ∼3.8 hours. The following 6 traces (7 to 12) show the depressive effect of the SDs on the spontaneous brain activity as assessed in the higherContinued.frequency band (AC-ECoG, bandpass: 0.5–45 Hz). Note that the activity depression propagated together with the SDs in the tissue (red arrows). The first SD caused a relatively short depression of spontaneous activity at electrodes 1 and 2, while it caused persistent depression of spontaneous activity at electrodes 3–6. Thus, SDs 2 to 10 partially propagated in electrically silent tissue and are classified accordingly as isoelectric-SDs (Dreier et al. 2017). Of note, the longest SD-induced activity depression is found at electrode 5 (trace 11) where the NUP occurred and the longitudinal MRIs showed the small delayed cortical infarct (cf. b). Trace 13 provides cerebral perfusion pressure ( = mean arterial pressure – intracranial pressure). Trace 14 shows intracranial pressure measured via extraventricular drainage (EVD) catheter. Trace 15 shows mean arterial pressure (measured via radial artery catheter). (b) Comparison between the early postoperative MRI on day five and the late MRI on day 19 revealed a new hyperintensity anteromedial to electrode five on the late diffusion-weighted image (DWI) and an increased signal on the corresponding fluid-attenuation inversion recovery (FLAIR) image. This is consistent with a small delayed cortical infarct next to electrode 5 that developed between day five and 19. One has to look carefully to see this, not only because the lesion was relatively small, but also because of a signal loss anterosuperior to electrode 5 due to a titanium clamp used for bone flap fixation. (c) The 3D scheme illustrates ECoG electrodes 1 to 6 in relation to the delayed infarct (purple).

