Figure 3.
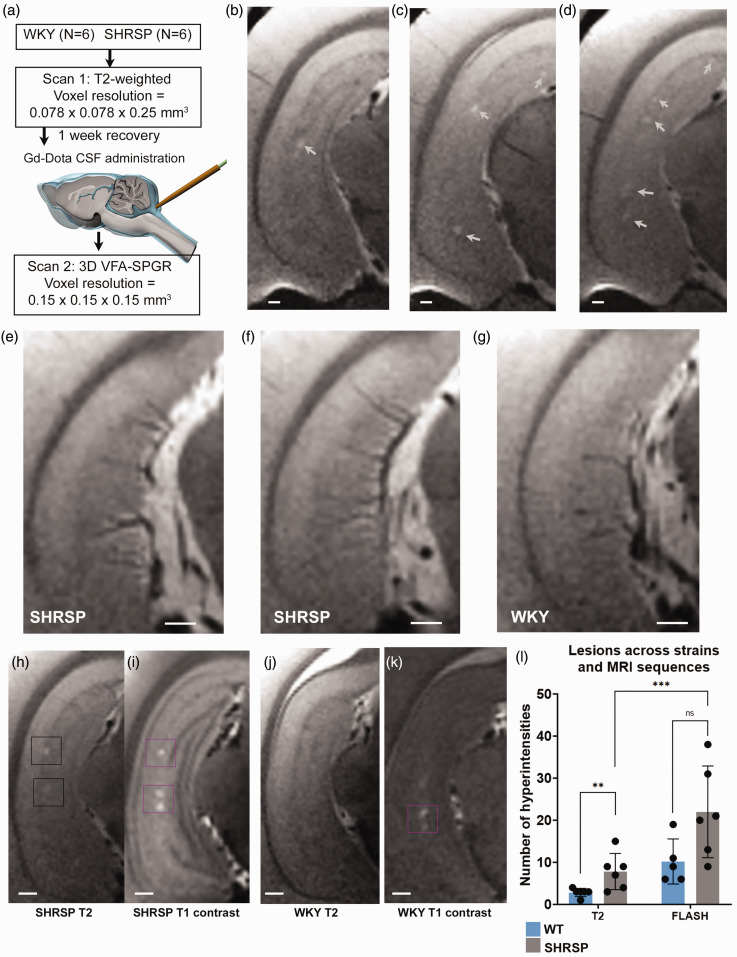
PVS-like hyperintensity lesions are increased in SHRSP compared to WKY rats (a) Overview of experimental study design. (b–d) Representative T2-weighted MRI at the level of the ventral hippocampus from three different SHRSP rats showing PVS-like hyperintensity lesions along the sulcus (white arrows). (e, f) Representative T2-weighted images from two different SHRSP further ventral in the hippocampus showing linearly shaped hyperintensity areas along the penetrating vasculature. (g) Corresponding T2-weighted image from a normal WKY rat showing penetrating vasculature without enlarged PVS. (h, i) T2- and corresponding post-contrast T1-weighted MRI from a SHRSP rats showing more PVS-like hyperintensity lesions on the latter image. (j, k) Corresponding MRI images from a normal WKY rat showing hyperintensity spots (magenta box) on the T1 contrast image but not on the T2-weighted image and (l) graph showing the number of lesions in WKY and SHRSP across the two different MRI sequences. Data are mean ± SD.

